Indicators: dTrends - MT5
Hi Roberto,
I think you made a great helping tool indicator.
I only have one question:
I found out that when I draw a trendline in one timeframe and after that I switch to another timeframe the drawed items are all gone.
Trendlines, fibonaccis and/or boxes (doesn´t matter)
I checked, but it is this indicator why it happens.
Is there any change to make us an update and delete this inside your indicator?
thank you in advance
Regards.
Albert
In the indicator where you made this comment, there is absolutely no trend line, fibonacci or box.
In the indicator where you made this comment, there is absolutely no trend line, fibonacci or box.
Hi Roberto
I did not mean to say that a trendline or anything else is drawn by the indicator.
Sorry, I may not have explained myself properly.
What I wanted to say is that with the indicator on a chart, the following happens:
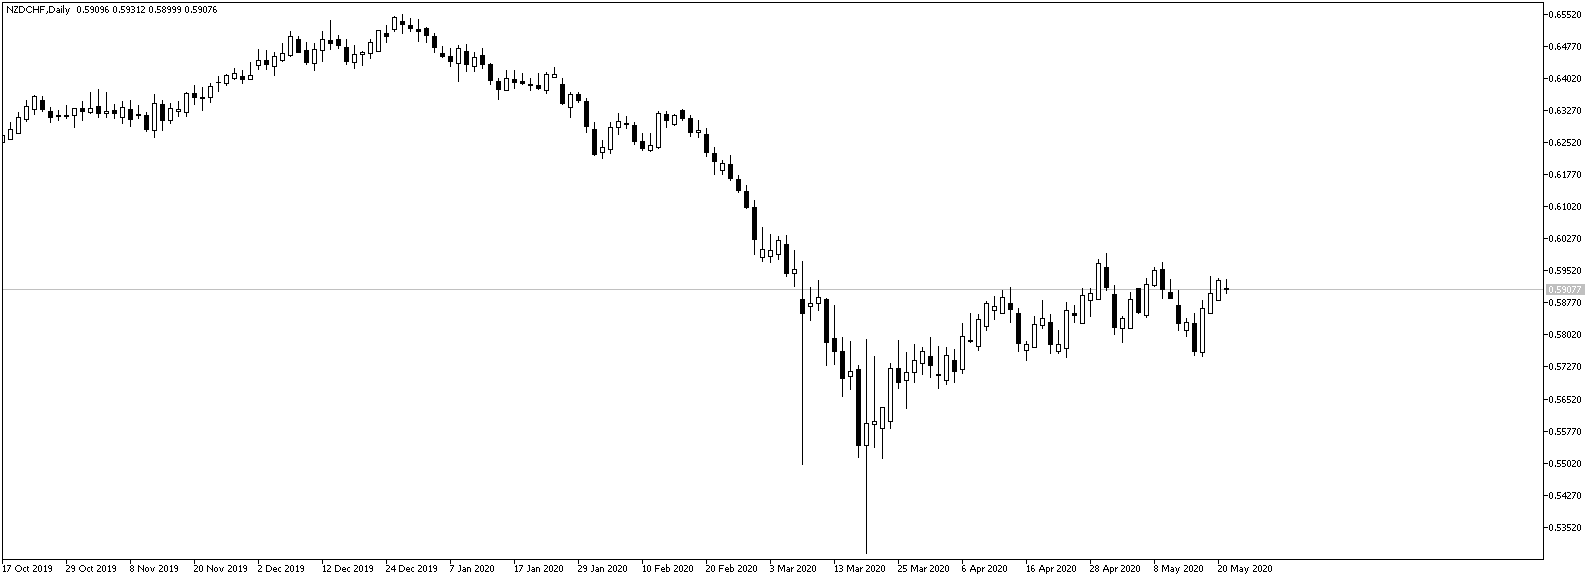
Imagine you are on the daily chart and you draw a trendline on the chart.
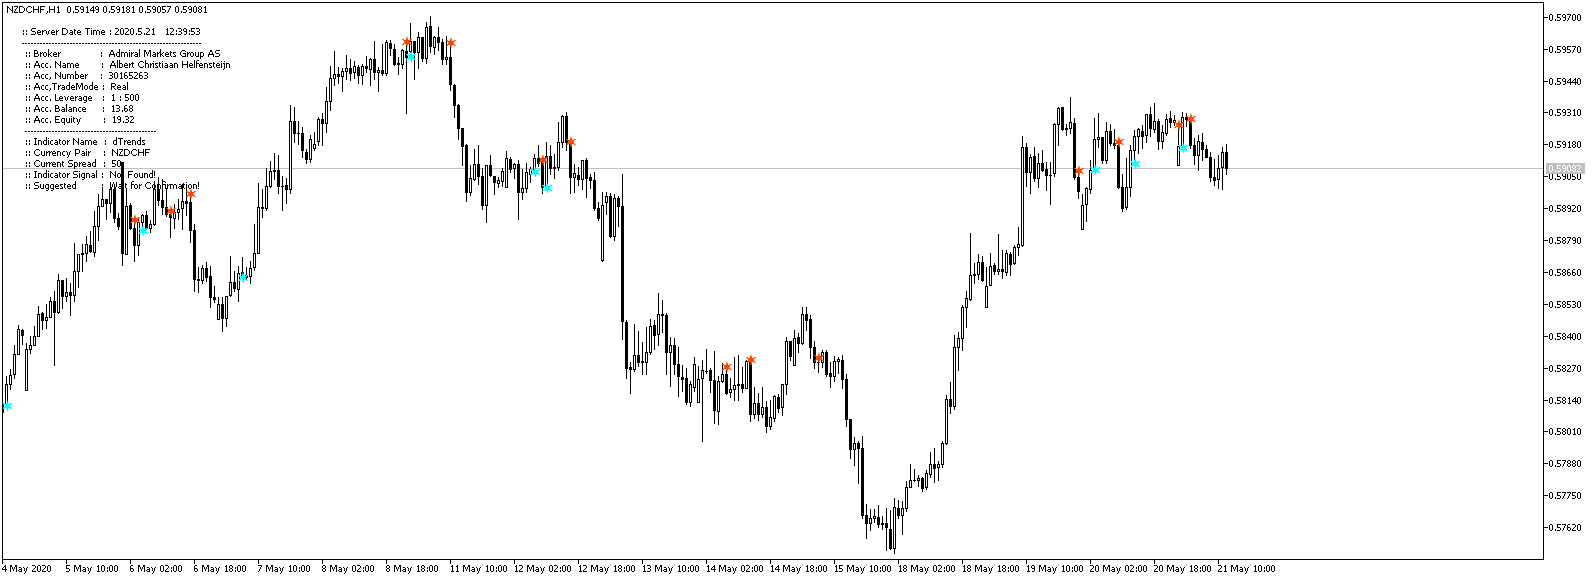
If you want to check the price action then on the hourly chart, the trendline previously drawn on the daily chart is gone.
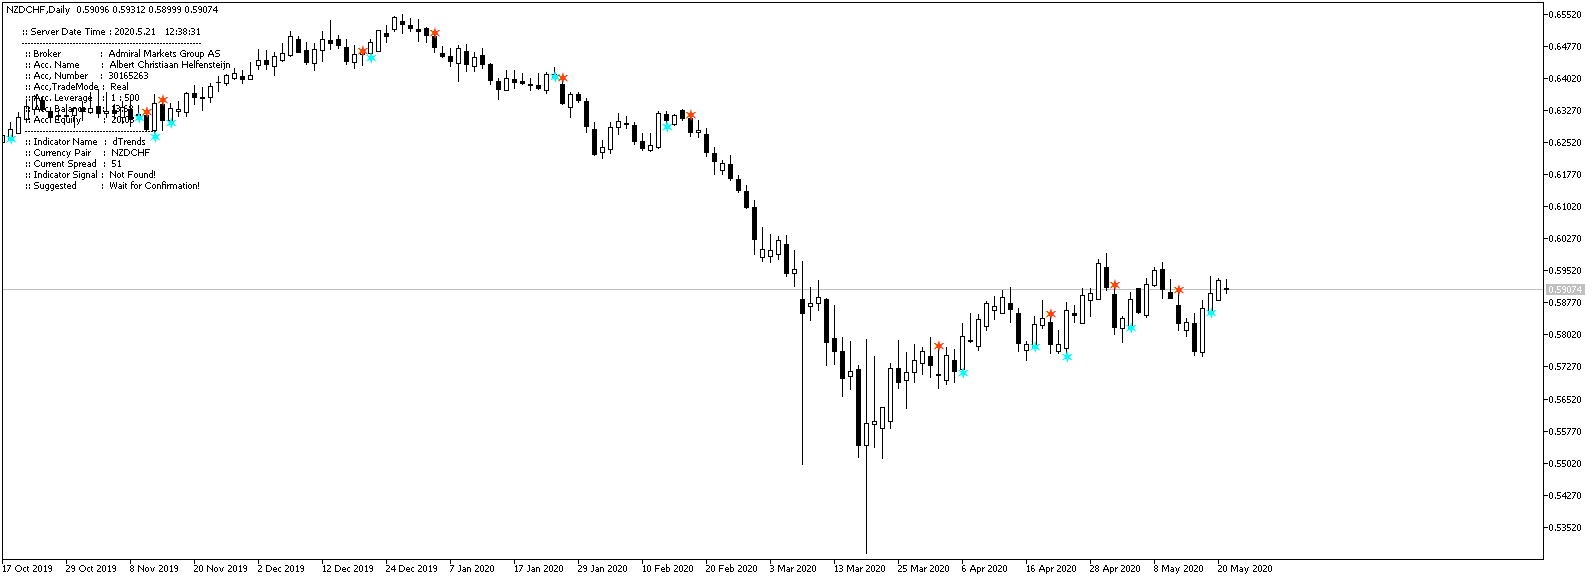
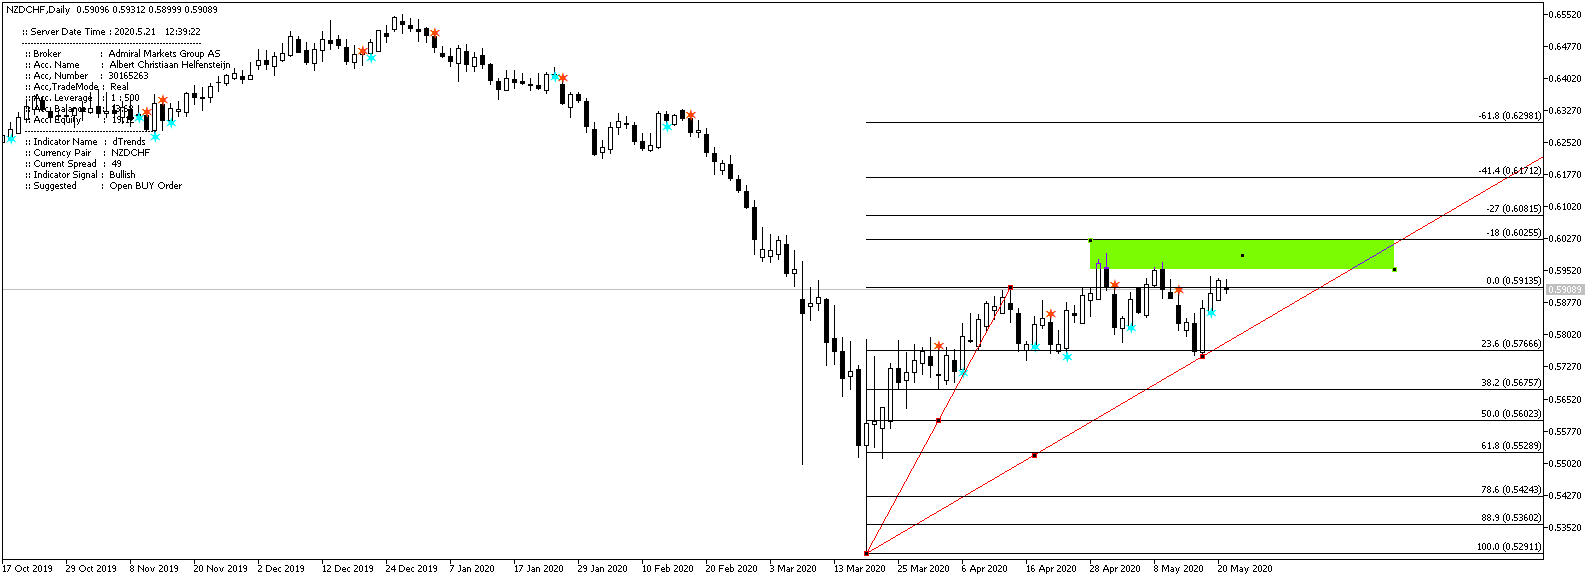
The same happens when you draw i.e. a fibonnaci or a box or triangle for patterns.
Once you switch from one TF to another TF, the chart is completely cleared.
See attached example images.
Thank you for your quick reply and I hope you understand my point.
Thank you in advance
Regards,
Hi Roberto
I did not mean to say that a trendline or anything else is drawn by the indicator.
Sorry, I may not have explained myself properly.
What I wanted to say is that with the indicator on a chart, the following happens:
Imagine you are on the daily chart and you draw a trendline on the chart.
If you want to check the price action then on the hourly chart, the trendline previously drawn on the daily chart is gone.
The same happens when you draw i.e. a fibonnaci or a box or triangle for patterns.
Once you switch from one TF to another TF, the chart is completely cleared.
See attached example images.
Thank you for your quick reply and I hope you understand my point.
Thank you in advance
Regards,
Look at the OnDeinit function:
/*
In the OnDeinit function, there is a function
ObjectsDeleteAll (ChartID(),0,-1);
do this in front of that function
//ObjectsDeleteAll(ChartID(),0,-1);
*/
void OnDeinit(const int reason)
  {
//----
   Comment("");
   //ObjectsDeleteAll(ChartID(),0,-1);
//----
   return;
  }
//-----//
Hi Roberto,
Thanks a lot
Worked it out.
Now it is OK
Kind regards.
You're welcome.
- Free trading apps
- Over 8,000 signals for copying
- Economic news for exploring financial markets
You agree to website policy and terms of use
dTrends:
Arrow trends by iBearsPower and iBullsPower indicator for MT5
Author: Roberto Jacobs