Diagnosis and Prediction of Tipping Points in Financial Markets ( Log-Periodic Power Law Model (LPPL) for Bubble Detection )
Forum on trading, automated trading systems and testing trading strategies
Sergey Golubev, 2019.06.29 17:55
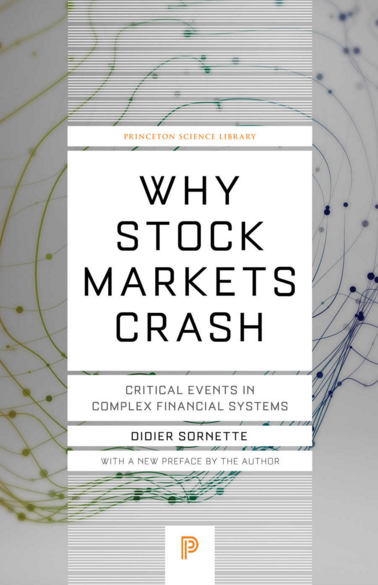
Why
Stock Markets Crash: Critical Events in Complex Financial Systems
by Didier Sornette

The scientific study of complex systems has transformed a wide range of disciplines in recent years, enabling researchers in both the natural and social sciences to model and predict phenomena as diverse as earthquakes, global warming, demographic patterns, financial crises, and the failure of materials. In this book, Didier Sornette boldly applies his varied experience in these areas to propose a simple, powerful, and general theory of how, why, and when stock markets crash.
Any investor or investment professional who seeks a genuine understanding of looming financial disasters should read this book. Physicists, geologists, biologists, economists, and others will welcome Why Stock Markets Crash as a highly original "scientific tale," as Sornette aptly puts it, of the exciting and sometimes fearsome--but no longer quite so unfathomable--world of stock markets.
I came to first know about Didier Sornette from his TED talk
https://www.ted.com/talks/didier_sornette_how_we_can_predict_the_next_financial_crisis?language=en
The guy is a genius he has a Phd and he is in the filed for many years
Here is a link with python code for the LPPL model
https://boulderinvestment.tech/blog/2018/log-periodic-power-law-lppl-model-for-bubble-detection

And I found few posts/threads on the forum related to it -
----------------
More -
============
Goetzel cycles
(look at Goertzel algorithm page in wikipedia)
- Goertzel indicators and how to use them - the post
- Goertzel browser indicator - the post
- Goertzel browser - end point indicator - the post
- Goertzel browser 1 indicator - the post
- Goertzel browser 2 indicator - the post
- Goertzel browser - end point 2 indicator - the post
- Fourier extrapolation of Goertzel indicator and Fourier extrapolation of Goertzel 2.1 indicator - the post
- Goertzel browser 3 indicator - the post
- Goertzel browser 3 mtf indicator - the post
- Goertzel browser 3 mtf-1 indicator - the post: It is interpolated and MTF version of Goertzel browser.
- Goertzel cycle indicator - the post
- Goertzel browser 4 indicator - the post: Goetzel cycles calculation is used in this indicators to identify currently existing cycles in signal and that is the list of cycles that the indicator is writing out. Indicator itself is combining those waves into a single wave (that is the "composite wave" that has been mentioned a couple of times) which is showing much more "readable" information.
- Goertzel browser 5 indicator - the post
- Goertzel browser 5.2 indicator - the post
- Goertzel browser 5.2.1 indicator - the post
- Goertzel browser 5.53 indicator - the post: Added "PeakSpan" parameter which allows to have more than one bar colored around the peak.
- Goertzel browser 5.1_CS_Detrend&Smooth indicator - the post

- 2014.03.23
- www.mql5.com
- www.pfr.com
- Free trading apps
- Over 8,000 signals for copying
- Economic news for exploring financial markets
You agree to website policy and terms of use
Many studies exists for the Log-Periodic Power Law Model (LPPL) for Bubble Detection based on the article " Diagnosis and Prediction of Tipping Points in Financial Markets Crashes and Rebounds by Didier Sornettea " and his book " Why Stock Markets Crash Critical Events in Complex Financial Systems
His work provides framework to detect bubbles and predict major changes in the market, and claims to have good accuracy
I found several python codes on the internet, and I plan to research this area, but I wonder if there is something done in MT4 on this field or not ?