Indicators: Japanese Candlestick Patterns - page 2
You are missing trading opportunities:
- Free trading apps
- Over 8,000 signals for copying
- Economic news for exploring financial markets
Registration
Log in
You agree to website policy and terms of use
If you do not have an account, please register
Forum on trading, automated trading systems and testing trading strategies
Libraries: MQL5 Wizard - Candlestick Patterns Class
newdigital, 2013.09.16 08:38
Gravestone Doji
The Gravestone Doji is a significant bearish reversal candlestick pattern that mainly occurs at the top of uptrends.
The Gravestone Doji is created when the open, low, and close are the same or about the same price (Where the open, low, and close are exactly the same price is quite rare). The most important part of the Graveston Doji is the long upper shadow.
The long upper shadow is generally interpreted by technicians as meaning that the market is testing to find where supply and potential resistance is located.
The construction of the Gravestone Doji pattern occurs when bulls are able to press prices upward.
However, an area of resistance is found at the high of the day and selling pressure is able to push prices back down to the opening price. Therefore, the bullish advance upward was entirely rejected by the bears.
Gravestone Doji ExampleThe chart below of Altria (MO) stock illustrates a Gravestone Doji that occured at the top of an uptrend:
In the chart above of Altria (MO) stock, the market began the day testing to find where support would enter the market. Altria eventually found resistance at the high of the day, and subsequently fell back to the opening's price.
The Gravestone Doji is an extremely helpful Candlestick reversal pattern to help traders visually see where resistance and supply is likely located. After an uptrend, the Gravestone Doji can signal to traders that the uptrend could be over and that long positions should probably be exited. But other indicators should be used in conjunction with the Gravestone Doji pattern to determine an actual sell signal. A potential trigger could be a break of the upward trendline support.
The reverse of the Gravestone Doji is the bullish Dragonfly DojiForum on trading, automated trading systems and testing trading strategies
Libraries: MQL5 Wizard - Candlestick Patterns Class
newdigital, 2013.09.16 18:44
Hammer
The Hammer candlestick formation is a significant bullish reversal candlestick pattern that mainly occurs at the bottom of downtrends.
The Hammer formation is created when the open, high, and close are roughly the same price. Also, there is a long lower shadow, twice the length as the real body.
When the high and the close are the same, a bullish Hammer candlestick is formed and it is considered a stronger formation because the bulls were able to reject the bears completely plus the bulls were able to push price even more past the opening price.
In contrast, when the open and high are the same, this Hammer formation is considered less bullish, but nevertheless bullish. The bulls were able to counteract the bears, but were not able to bring the price back to the price at the open.
The long lower shadow of the Hammer implies that the market tested to find where support and demand was located. When the market found the area of support, the lows of the day, bulls began to push prices higher, near the opening price. Thus, the bearish advance downward was rejected by the bulls.
Hammer Candlestick Chart ExampleThe chart below of American International Group (AIG) stock illustrates a Hammer reversal pattern after a downtrend:
In the chart above of AIG, the market began the day testing to find where demand would enter the market. AIG's stock price eventually found support at the low of the day. In fact, there was so much support and subsequent buying pressure, that prices were able to close the day even higher than the open, a very bullish sign.
The Hammer is an extremely helpful candlestick pattern to help traders visually see where support and demand is located. After a downtrend, the Hammer can signal to traders that the downtrend could be over and that short positions should probably be covered.
However, other indicators should be used in conjunction with the Hammer candlestick pattern to determine buy signals, for example, waiting a day to see if a rally off of the Hammer formation continues or other chart indications such as a break of a downward trendline. But other previous day's clues could enter into a traders analysis. An example of these clues, in the chart above of AIG, shows three prior day's Doji's (signs of indecision) that suggested that prices could be reversing trend; in that case and for an aggressive buyer, the Hammer formation could be the trigger to go long.
The bearish version of the Hammer is the Hanging Man formation
Another similar candlestick pattern to the Hammer is the Dragonfly Doji
Forum on trading, automated trading systems and testing trading strategies
Libraries: MQL5 Wizard - Candlestick Patterns Class
newdigital, 2013.09.17 12:28
Hanging ManThe Hanging Man candlestick formation, as one could predict from the name, is a bearish sign. This pattern occurs mainly at the top of uptrends and is a warning of a potential reversal downward. It is important to emphasize that the Hanging Man pattern is a warning of potential price change, not a signal, in and of itself, to go short.
The Hanging Man formation, just like the Hammer, is created when the open, high, and close are roughly the same price. Also, there is a long lower shadow, which should be at least twice the length of the real body.
When the high and the open are the same, a bearish Hanging Man candlestick is formed and it is considered a stronger bearish sign than when the high and close are the same, forming a bullish Hanging Man (the bullish Hanging Man is still bearish, just less so because the day closed with gains).
After a long uptrend, the formation of a Hanging Man is bearish because prices hesitated by dropping significantly during the day. Granted, buyers came back into the stock, future, or currency and pushed price back near the open, but the fact that prices were able to fall significantly shows that bears are testing the resolve of the bulls. What happens on the next day after the Hanging Man pattern is what gives traders an idea as to whether or not prices will go higher or lower.
Hanging Man Candlestick Chart ExampleThe chart below of Alcoa (AA) stock illustrates a Hanging Man, and the large red bearish candle after the Hanging Man strengthens the bears thinking that a downward reversal is coming:
In the chart above of Alcoa, the market began the day testing to find where demand would enter the market. Alcoa's stock price eventually found support at the low of the day. The bears' excursion downward was halted and prices ended the day slightly above the close.
Confirmation that the uptrend was in trouble occured when Alcoa gapped down the next day and continued downward creating a large bearish red candle. To some traders, this confirmation candle, plus the fact that the upward trendline support was broken, gave the signal to go short.
It is important to repeat, that the Hanging Man formation is not the sign to go short; other indicators such as a trendline break or confirmation candle should be used to generate sell signals.
The bullish version of the Hanging Man is the Hammer formationForum on trading, automated trading systems and testing trading strategies
Libraries: MQL5 Wizard - Candlestick Patterns Class
newdigital, 2013.09.17 14:23
Harami
The Harami (meaning "pregnant" in Japanese) Candlestick Pattern is a reversal pattern. The pattern consists of two Candlesticks:
The Harami Pattern is considered either bullish or bearish based on the criteria below:
Bearish Harami: A bearish Harami occurs when there is a large bullish green candle on Day 1 followed by a smaller bearish or bullish candle on Day 2. The most important aspect of the bearish Harami is that prices gapped down on Day 2 and were unable to move higher back to the close of Day 1. This is a sign that uncertainty is entering the market.
Bullish Harami: A bullish Harami occurs when there is a large bearish red candle on Day 1 followed by a smaller bearish or bullish candle on Day 2. Again, the most important aspect of the bullish Harami is that prices gapped up on Day 2 and price was held up and unable to move lower back to the bearish close of Day 1.
Harami Candlestick Chart ExampleThe chart below of the Nasdaq 100 E-mini Futures contract shows an example of both a bullish and bearish Harami candlestick pattern:
The first Harami pattern shown above on the chart of the E-mini Nasdaq 100 Future is a bullish reversal Harami. First there was a long bearish red candle. Second, the market gapped up at the open. In the case above, Day 2 was a bullish candlestick, which made the bullish Harami even more bullish.
Harami Candlestick Buy SignalA buy signal could be triggered when the day after the bullish Harami occured, price rose higher, closing above the downward resistance trendline. A bullish Harami pattern and a trendline break is a potent combination resulting in a strong buy signal.
The second Harami pattern shown above on the chart of the E-mini Nasdaq 100 Future is a bearish reversal Harami. The first candle was a long bullish green candle. On the second candle, the market gapped down at the open. The chart above of the e-mini shows that Day 2 was a bearish candlestick; this made the bearish Harami even more bearish.
Harami Candlestick Sell SignalA sell signal could be triggered when the day after the bearish Harami occured, price fell even further down, closing below the upward support trendline. When combined, a bearish Harami pattern and a trendline break is a strong indication to sell.
A somewhat opposite two candlestick reversal pattern is the Bearish Engulfing PatternForum on trading, automated trading systems and testing trading strategies
Libraries: MQL5 Wizard - Candlestick Patterns Class
newdigital, 2013.09.18 12:33
Inverted Hammer
The Inverted Hammer candlestick formation occurs mainly at the bottom of downtrends and is a warning of a potential reversal upward. It is important to note that the Inverted pattern is a warning of potential price change, not a signal, in and of itself, to buy.
The Inverted Hammer formation, just like the Shooting Star formation, is created when the open, low, and close are roughly the same price. Also, there is a long upper shadow, which should be at least twice the length of the real body.
When the low and the open are the same, a bullish Inverted Hammer candlestick is formed and it is considered a stronger bullish sign than when the low and close are the same, forming a bearish Hanging Man (the bearish Hanging Man is still considered bullish, just not as much because the day ended by closing with losses).
After a long downtrend, the formation of an Inverted Hammer is bullish because prices hesitated their move downward by increasing significantly during the day. Nevertheless, sellers came back into the stock, future, or currency and pushed prices back near the open, but the fact that prices were able to increase significantly shows that bulls are testing the power of the bears. What happens on the next day after the Inverted Hammer pattern is what gives traders an idea as to whether or not prices will go higher or lower.
Inverted Hammer Candlestick Chart ExampleThe chart below of the S&P 500 Futures contract shows the Inverted Hammer foreshadowing future price increases:
In the chart above of e-mini future, the market began the day by gapping down. Prices moved higher, until resistance and supply was found at the high of the day. The bulls' excursion upward was halted and prices ended the day below the open.
Confirmation that the dowtrend was in trouble occured the next day when the E-mini S&P 500 Futures contract gapped up the next day and continued to move upward, creating a bullish green candle. To some traders, this confirmation candle, plus the fact that the downward trendline resistance was broken, gave the signal to go long.
It is important to repeat, that the Inverted Hammer formation is not the signal to go long; other indicators such as a trendline break or confirmation candle should be used to generate the actual buy signal.
The bearish version of the Inverted Hammer is the Shooting Star formationForum on trading, automated trading systems and testing trading strategies
Libraries: MQL5 Wizard - Candlestick Patterns Class
newdigital, 2013.09.18 12:41
Morning Star
The Morning Star Pattern is a bullish reversal pattern, usually occuring at the bottom of a downtrend. The pattern consists of three candlesticks:
The first part of a Morning Star reversal pattern is a large bearish red candle. On the first day, bears are definitely in charge, usually making new lows.
The second day begins with a bearish gap down. It is clear from the opening of Day 2 that bears are in control. However, bears do not push prices much lower. The candlestick on Day 2 is quite small and can be bullish, bearish, or neutral (i.e. Doji).
Generally speaking, a bullish candle on Day 2 is a stronger sign of an impending reversal. But it is Day 3 that holds the most significance.
Day 3 begins with a bullish gap up, and bulls are able to press prices even further upward, often eliminating the losses seen on Day 1.
Morning Star Candlestick Chart ExampleThe chart below of the S&P 400 Midcap exchange traded fund (MDY) shows an example a Morning Star bullish reversal pattern that occured at the end of a downtrend:
Day 1 of the Morning Star pattern for the Midcap 400 (MDY) chart above was a strong bearish red candle. Day 2 continued Day 1's bearish sentiment by gapping down. However, Day 2 was a Doji, which is a candlestick signifying indecision. Bears were unable to continue the large decreases of the previous day; they were only able to close slightly lower than the open.
Day 3 began with a bullish gap up. The bulls then took hold of the Midcap 400 exchange traded fund for the entire day. Also, Day 3 broke above the downward trendline that had served as resistance for MDY for the past week and a half. Both the trendline break and the classic Morning Star pattern gave traders a signal to go long and buy the Midcap 400 exchange traded fund.
The Morning Star pattern is a very powerful three candlestick bullish reversal pattern. The bearish equivalent of the Morning Star is the Evening Star patternForum on trading, automated trading systems and testing trading strategies
Libraries: MQL5 Wizard - Candlestick Patterns Class
newdigital, 2013.09.18 14:53
Piercing Line Pattern
The Piercing Pattern is a bullish candlestick reversal pattern, similar to the Bullish Engulfing Pattern (see: Bullish Engulfing Pattern). There are two components of a Piercing Pattern formation:
A Piercing Pattern occurs when a bullish candle on Day 2 closes above the middle of Day 1's bearish candle.
Moreover, price gaps down on Day 2 only for the gap to be filled (see: Gaps) and closes significantly into the losses made previously in Day 1's bearish candlestick.
The rejection of the gap up by the bulls is a major bullish sign, and the fact that bulls were able to press further up into the losses of the previous day adds even more bullish sentiment. Bulls were successful in holding prices higher, absorbing excess supply and increasing the level of demand.
Piercing Pattern Candlestick Chart ExampleThe chart below of Intel (INTC) stock illustrates an example of the Piercing Pattern:
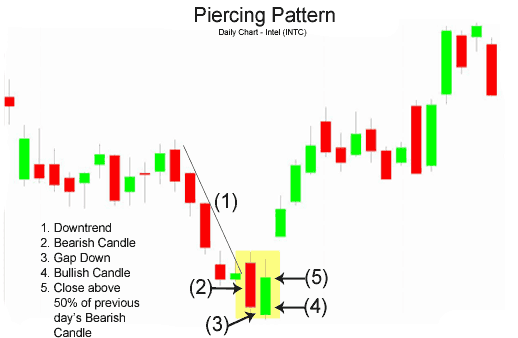
Piercing Pattern Candlestick Buy SignalGenerally other technical indicators are used to confirm a buy signal given by the Piercing Pattern (i.e. downward trendline break). Since the Piercing Pattern means that bulls were unable to completely reverse the losses of Day 1, more bullish movement should be expected before an outright buy signal is given. Also, more volume than usual on the bullish advance on Day 2 is a stronger indicator that bulls have taken charge and that the prior downtrend is likely ending.
A more bullish reversal pattern is the Bullish Engulfing Pattern that completely reverses the losses of Day 1 and adds new gains.
For further study, the bearish equivalent of the Piercing Pattern is the Dark Cloud Cover Pattern
Forum on trading, automated trading systems and testing trading strategies
Libraries: MQL5 Wizard - Candlestick Patterns Class
newdigital, 2013.09.18 22:29
Shooting Star
The Shooting Star candlestick formation is a significant bearish reversal candlestick pattern that mainly occurs at the top of uptrends.
The Shooting formation is created when the open, low, and close are roughly the same price. Also, there is a long upper shadow, generally defined as at least twice the length of the real body.
When the low and the close are the same, a bearish Shooting Star candlestick is formed and it is considered a stronger formation because the bears were able to reject the bulls completely plus the bears were able to push prices even more by closing below the opening price.
The Shooting Star formation is considered less bearish, but nevertheless bearish when the open and low are roughly the same. The bears were able to counteract the bulls, but were not able to bring the price back to the price at the open.
The long upper shadow of the Shooting Star implies that the market tested to find where resistance and supply was located. When the market found the area of resistance, the highs of the day, bears began to push prices lower, ending the day near the opening price. Thus, the bullish advance upward was rejected by the bears.
Shooting Star Candlestick Chart ExampleThe chart below of Cisco Systems (CSCO) illustrates a Shooting Star reversal pattern after an uptrend:
In the chart above of CSCO, the market began the day testing to find where supply would enter the market. CSCO's stock price eventually found resistance at the high of the day. In fact, there was so much resistance and subsequent selling pressure, that prices were able to close the day significantly lower than the open, a very bearish sign.
The Shooting Star is an extremely helpful candlestick pattern to help traders visually see where resistance and supply is located. After an uptrend, the Shooting Star pattern can signal to traders that the uptrend could be over and that long positions should probably be reduced or completely exited.
However, other indicators should be used in conjunction with the Shooting Star candlestick pattern to determine sell signals, for example, waiting a day to see if prices continued falling or other chart indications such as a break of an upward trendline.
For aggressive traders, the Shooting Star pattern illustrated above could be used as the sell signal. The red portion of the candle (the difference between the open and close) was so large with CSCO, that it could be considered the same as a bearish candle occuring on the next day. However, caution would have to be used because the close of the Shooting Star rested right at the uptrend support line for Cisco Systems.
Generally speaking though, a trader should wait for a confirmation candle before entering.
The bullish version of the Shooting Star formation is the Inverted Hammer formation that occurs at bottoms. Another similar candlestick pattern in look and interpretation to the Shooting Star pattern is the Gravestone DojiForum on trading, automated trading systems and testing trading strategies
Libraries: MQL5 Wizard - Candlestick Patterns Class
newdigital, 2013.09.19 13:17
Tweezer Tops and Bottoms
The Tweezer Top formation is a bearish reversal pattern seen at the top of uptrends and the Tweezer Bottom formation is a bullish reversal pattern seen at the bottom of downtrends.
Tweezer Top formation consists of two candlesticks:
Tweezer Bottom formation consists of two candlesticks:
Sometimes Tweezer Tops or Bottoms have three candlesticks.
A bearish Tweezer Top occurs during an uptrend when bulls take prices higher, often closing the day off near the highs (a bullish sign). However, on the second day, how traders feel (i.e. their sentiment) reverses completely. The market opens and goes straight down, often eliminating the entire gains of Day 1.
The reverse, a bullish Tweezer Bottom occurs during a downtrend when bears continue to take prices lower, usually closing the day near the lows (a bearish sign). Nevertheless, Day 2 is completely opposite because prices open and go nowhere but upwards. This bullish advance on Day 2 sometimes eliminates all losses from the previous day.
Tweezer Bottom Candlestick Chart ExampleA Tweezer Bottom is shown below in the chart of Exxon-Mobil (XOM) stock:
The bears pushed the price of Exxon-Mobil (XOM) downwards on Day 1; however, the market on Day 2 opened where prices closed on Day 1 and went straight up, reversing the losses of Day 2. A buy signal would generally be given on the day after the Tweezer Bottom, assuming the candlestick was bullish green.
Intra-day Tweezer Tops and BottomsThe bullish Tweezer Bottom formation shown on the last page of the daily chart of Exxon-Mobil is shown below with a 15-minute chart spanning the two days the Tweezer Bottom pattern was emerging:
Notice how Exxon-Mobil (XOM) stock went downwards the whole day on Day 1. Then on Day 2, the bearish sentiment of Day 1 was completely reversed and XOM stock went up the whole day. This sudden and drastic change of opinion between Day 1 and Day 2 could be viewed as an overnight transfer of power from bears to bulls.
The 15-minute chart below of the E-mini Russell 2000 Futures contract shows how a three day Tweezer Top usually develops:
On Day 1, the bulls were in charge of the Russell 2000 E-mini. On Day 2, however, the bulls began the day trying to make a new high, but were rejected by the overhead resistance created by the prior day's highs. The market then sank quickly only to recover halfway by the end of the close on Day 2. Day 3 opened with a spectacular gap up, but the bulls were promptly rejected by the bears at the now established resistance line. The Russell 2000 E-mini then fell for the rest of the day. Many classic chartists will recognize this triple Tweezer Top as a Double Top formation (see: Double Top).
The Tweezer Top and Bottom reversal pattern is extremely helpful because it visually indicates a transfer of power and sentiment from the bulls and the bears. Of course other technical indicators should be consulted before making a buy or sell signal based on the Tweezer patterns.
Forum on trading, automated trading systems and testing trading strategies
Libraries: MQL5 Wizard - Candlestick Patterns Class
newdigital, 2013.09.19 13:31
Windows (Gaps)
Windows as they are called in Japanese Candlestick Charting, or Gaps, as they are called in the west, are an important concept in technical analysis. Whenever, there is a gap (current open is not the same as prior closing price), that means that no price and no volume transacted hands between the gap.
A Gap Up occurs when the open of Day 2 is greater than the close of Day 1. Contrastly, a Gap Down occurs when the open of Day 2 is less than the close of Day 1.
There is much psychology behind gaps. Gaps can act as:
Resistance: Once price gaps downward, the gap can act as long-term or even permanent resistance.
Support: When prices gap upwards, the gap can act as support to prices in the future, either long-term or permanently.
Windows Example - Gaps as Support & ResistanceThe chart below of eBay (EBAY) stock shows the gap up acting as support for prices.
Often after a gap, prices will do what is referred to as "fill the gap". This occurs quite often. Think of a gap as a hole in the price chart that needs to be filled back in. Another common occurance with gaps is that once gaps are filled, the gap tends to reverse direction and continue its way in the direction of the gap (for example, in the chart above of eBay, back upwards).
The example of eBay (EBAY) above shows the gap acting as support. Traders and investors see anything below the gap as an area of no return, after all, there was probably some positive news that sparked the gap up and is still in play for the company.
The chart below of Wal-Mart (WMT) stock shows many instances of gaps up and gaps down. Notice how gaps down act as areas of resistance and gaps up as areas of support:
Gaps are important areas on a chart that can help a technical analysis trader better find areas of support or resistance. For more information on how support and resistance work and how they can be used for trading. Also, Gaps are an important part of most Candlestick Charting patterns; for a list of candlestick pattern charts and descriptions.