Libraries: MQL5 Wizard - Candlestick Patterns Class
newdigital, 2013.09.16 18:44
The Hammer candlestick formation is a significant bullish reversal candlestick pattern that mainly occurs at the bottom of downtrends.

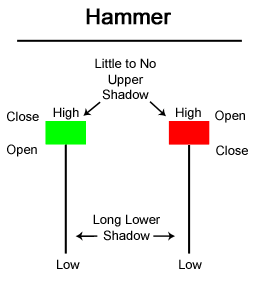
The Hammer formation is created when the open, high, and close are roughly the same price. Also, there is a long lower shadow, twice the length as the real body.
When the high and the close are the same, a bullish Hammer candlestick is formed and it is considered a stronger formation because the bulls were able to reject the bears completely plus the bulls were able to push price even more past the opening price.
In contrast, when the open and high are the same, this Hammer formation is considered less bullish, but nevertheless bullish. The bulls were able to counteract the bears, but were not able to bring the price back to the price at the open.
The long lower shadow of the Hammer implies that the market tested to find where support and demand was located. When the market found the area of support, the lows of the day, bulls began to push prices higher, near the opening price. Thus, the bearish advance downward was rejected by the bulls.
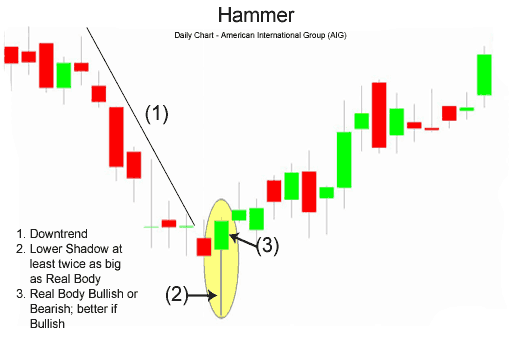
Hammer Candlestick Chart ExampleThe chart below of American International Group (AIG) stock illustrates a Hammer reversal pattern after a downtrend:

In the chart above of AIG, the market began the day testing to find where demand would enter the market. AIG's stock price eventually found support at the low of the day. In fact, there was so much support and subsequent buying pressure, that prices were able to close the day even higher than the open, a very bullish sign.
The Hammer is an extremely helpful candlestick pattern to help traders visually see where support and demand is located. After a downtrend, the Hammer can signal to traders that the downtrend could be over and that short positions should probably be covered.
However, other indicators should be used in conjunction with the Hammer candlestick pattern to determine buy signals, for example, waiting a day to see if a rally off of the Hammer formation continues or other chart indications such as a break of a downward trendline. But other previous day's clues could enter into a traders analysis. An example of these clues, in the chart above of AIG, shows three prior day's Doji's (signs of indecision) that suggested that prices could be reversing trend; in that case and for an aggressive buyer, the Hammer formation could be the trigger to go long.
The bearish version of the Hammer is the Hanging Man formation
Another similar candlestick pattern to the Hammer is the Dragonfly Doji
----------------
Hammer and Hanging Man Candlestick EA - expert for MetaTrader 5
Candlesticks patterns. Inverted Hammer (part #2)
Libraries: MQL5 Wizard - Candlestick Patterns Class
newdigital, 2013.09.18 12:33
The Inverted Hammer candlestick formation occurs mainly at the bottom of downtrends and is a warning of a potential reversal upward. It is important to note that the Inverted pattern is a warning of potential price change, not a signal, in and of itself, to buy.

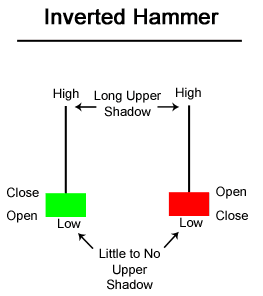
The Inverted Hammer formation, just like the Shooting Star formation, is created when the open, low, and close are roughly the same price. Also, there is a long upper shadow, which should be at least twice the length of the real body.
When the low and the open are the same, a bullish Inverted Hammer candlestick is formed and it is considered a stronger bullish sign than when the low and close are the same, forming a bearish Hanging Man (the bearish Hanging Man is still considered bullish, just not as much because the day ended by closing with losses).
After a long downtrend, the formation of an Inverted Hammer is bullish because prices hesitated their move downward by increasing significantly during the day. Nevertheless, sellers came back into the stock, future, or currency and pushed prices back near the open, but the fact that prices were able to increase significantly shows that bulls are testing the power of the bears. What happens on the next day after the Inverted Hammer pattern is what gives traders an idea as to whether or not prices will go higher or lower.
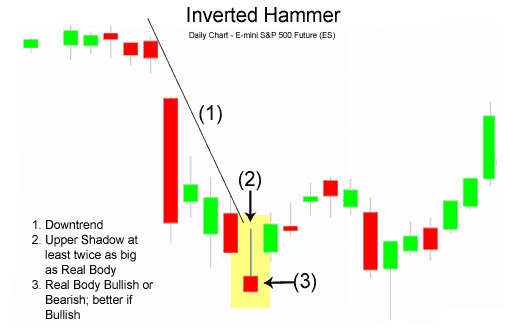
Inverted Hammer Candlestick Chart ExampleThe chart below of the S&P 500 Futures contract shows the Inverted Hammer foreshadowing future price increases:

In the chart above of e-mini future, the market began the day by gapping down. Prices moved higher, until resistance and supply was found at the high of the day. The bulls' excursion upward was halted and prices ended the day below the open.
Confirmation that the dowtrend was in trouble occured the next day when the E-mini S&P 500 Futures contract gapped up the next day and continued to move upward, creating a bullish green candle. To some traders, this confirmation candle, plus the fact that the downward trendline resistance was broken, gave the signal to go long.
It is important to repeat, that the Inverted Hammer formation is not the signal to go long; other indicators such as a trendline break or confirmation candle should be used to generate the actual buy signal.
The bearish version of the Inverted Hammer is the Shooting Star formation
----------------
Hammer and Hanging Man Candlestick EA - expert for MetaTrader 5
- Free trading apps
- Over 8,000 signals for copying
- Economic news for exploring financial markets
You agree to website policy and terms of use
4 hour rules are really wierd but if you stick around to read this which will be clear.
Let get right into it:
fundamental basic
you should know what is :
pull back look like:
Drop back:
Fact about hammers:
---> shows a lots in confirmation phase
---> halve way in the ascending and descending triangle rule
why do we need to know this?
I am glad to answered this because i have trading a lots in the try and error. here is what i know of.
----> It helps the trader to know where the re-test might be in the recent history data in 4hour time frame.
---> it is very useful for swing trader with little knowledge and awareness.
----> Signals machines are bad to sport it i out making it a disadvantage unless there is updated version to protect.
---> This set up is bit like day trip like a bus stop knowing where to get off which most trader don't know their exit plan.
lastly here is a combined skill:
Happy trading.
Please follow me and if you find it useful put your review here so i want you to be great trader.