[MT5] - Automatic Open H-Line AND V-Line

- www.mql5.com
Thanks for your reply.
I saw the link you sent me, and I confess I'm kind of lost here. Is this forum specific for programming? I thought I would find an easier solution, I have close to none knowledge of programming.
Okay in that case here is a working example that you can compile and put in the scripts folder.
Thank you friend. I've compiled and put on the chart, that's exactly what I'm looking for.
There are just small things I'd like to change. I saw the code and tried to figure out how to make the changes, but it's not working for me. I can only make it works the changes where there are 'true' or 'false' values. Other fields I can't make it work.
For example, I want to change the line's stile, so I try to change the value "style=STYLE_SOLID" to "style=STYLE_DASHDOT". But when I compile and put on chart, the change doesn’t show the new style in the chart. How do you do these changes?
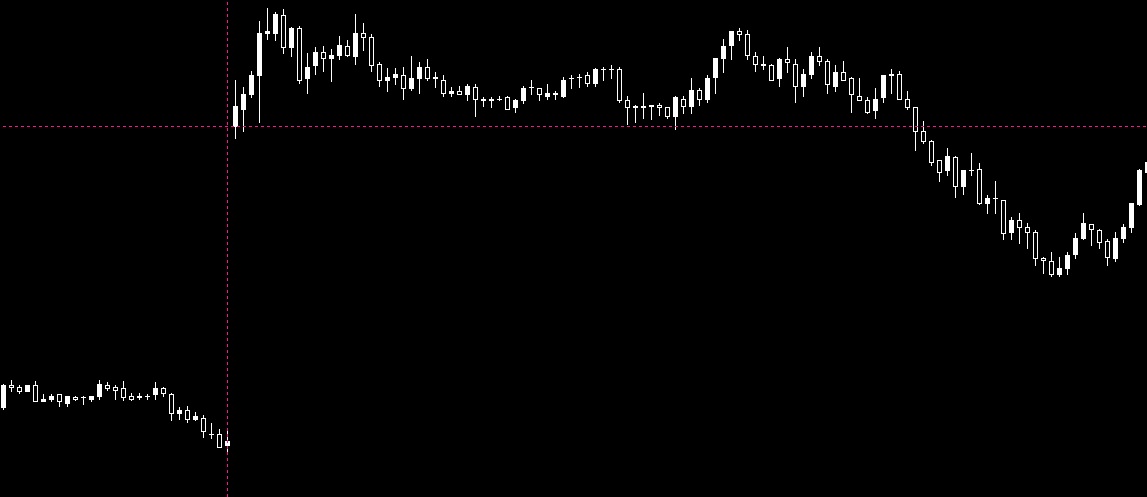
Another thing: the vertical line is not being positioned exactly in the first candle of the day, it's a little earlier. I'm annexing an image for you to see.
- Free trading apps
- Over 8,000 signals for copying
- Economic news for exploring financial markets
You agree to website policy and terms of use
Hello. This is my first post here in the forum.
I'm looking for an indicator or feature on MT5 that plots automatically a horizontal line and also a vertical line on the first candle of the current day. I've searched some options here and on the Web but couldn't find exactly what i'm looking for. To be more specific, I need a feature that provides this:
- plots on the chart a horizontal line and a vertical line on the first candle of the current day. The H-line must go all the way from the left to the right of the screen, and the V-line must go all the way from botton the the top of the screen.
- needs to work on any time frame (if I change the time frame, the lines keep showing on the chart. If I change do weekly TF, the lines will adjust to the last candle of the chart)
- to show the line only on the current day (do not show lines for the opening candles of the past days)
- need to give options to custom collor and style of the lines.
Hope someone could help me with this.
And sorry for any error with the English :)