Discussion of article "Horizontal diagrams on MеtaTrader 5 charts" - page 2
You are missing trading opportunities:
- Free trading apps
- Over 8,000 signals for copying
- Economic news for exploring financial markets
Registration
Log in
You agree to website policy and terms of use
If you do not have an account, please register
So you wrote an "abstract thing" that works in an approximate way, and even in an environment that does not exist in practice. I'm speechless.
And the rendering, as I pointed out above, is crooked. Very good PR for your products.
You are absolutely wrong. That the "thing" practically applies is shown in the examples. Charts are always averaged, didn't you know that? You can't draw them otherwise. If we are talking about VSA, as here, then there is no other way. And why is the drawing crooked? It draws fine. Perhaps you have a poorly configured terminal. I'm new to MQL, but still understood how to apply and where to place the sources. And the good thing is that this is not another indicator nobody needs, but an include file that I can add to the project. It's a pity that there are no comments, but you can ask the author. No offence, but you are biased for some reason.
I can see from your categorical statements that you are an "expert".
1. the fact that the "thing" is practically applied is shown on examples - what examples? Screenshots? All right, if you have found a practical application - good;
2. Diagrams are always averaged, didn't you know that? You can't draw them otherwise. - No, I didn't know that, because it's not true. Diagrams are drawn the way the developer intends them to be drawn. In this case, the developer is "averaging" over bars. You can average a lot more often, and the accuracy will increase accordingly. Didn't you know that? And yes, you can also build a histogram on tick data, then the accuracy will be maximised. But, apparently, the algorithm and classes are important here;
3. And why is the rendering crooked? Everything is drawn normally - do you see my screenshot? Do you see a draw error? Try scrolling the graph back and forth. Do you see delays in drawing (I ran the indicator on the data for the day)? Are you satisfied with it? If yes - it is good;
4. Perhaps you have a poorly configured terminal. I am a beginner in MQL - if you are a beginner, do not make such categorical statements. First, find out what you can do with the language's tools;
5. No offence, but you are biased for some reason - there are no offences, and there is no bias either. I just saw the title of the article and compared it with the implementation. And I realised that a lot of things were obviously not finished.
I can see by your categorical statements that you are an "expert".
1. the fact that the "thing" is practically applied is shown on examples - what examples? Screenshots? All right, if you have found a practical application - good;
2. Diagrams are always averaged, didn't you know that? You can't draw them otherwise. - No, I didn't know that, because it's not true. Diagrams are drawn the way the developer intends them to be drawn. In this case, the developer is "averaging" over bars. You can average a lot more often, and the accuracy will increase accordingly. Didn't you know that? And yes, you can also build a histogram on tick data, then the accuracy will be maximised. But I guess the algorithm and classes are important here;
3. And why is the rendering crooked? Everything is drawn normally - do you see my screenshot? Do you see a draw error? Try scrolling the graph back and forth. Do you see delays in drawing (I ran the indicator on the data for the day)? Are you satisfied with it? If yes, it is good;
4. Perhaps you have a poorly configured terminal. I am a beginner in MQL - if you are a beginner, don't make such categorical statements. First of all, understand what can be done with the language's tools;
5. No offence, but you are biased for some reason - there are no offences, and there is no bias either. I just saw the title of the article and compared it with the implementation. And I realised that a lot of things were obviously not finished.
You can build on tick data, it will be more accurate, but you don't need to do it. I am well acquainted with VSA, so there is no need for such a thing. And the tick history itself, at least for a month, such a broker is still to be found. Or I have an indicator that shows the histogram for the current month and for the last month, will it be easy to find such a tick history? And the accuracy of ticks is not necessary in this case.
Does the chart twitch if you flip it? Yes, it really does. It is not easy for the terminal to redraw many rectangles instantly.
You can build on tick data, it will be more accurate, but don't do it I am well acquainted with VSA, so there is no need for such a thing. And the tick history itself, at least for a month, such a broker is still to be found. Or I have an indicator that shows the histogram for the current month and for the last month, will it be easy to find such a tick history? And the accuracy of ticks is not necessary in this case.
Does the chart twitch if you flip it? Yes, it really does. It is not easy for the terminal to redraw many rectangles instantly.
Believe me, this is far from the limit.
Believe me, and this is far from the limit.
I do. And my broker is not. And my neighbours in Scotland are even worse. They have no minute history at all.
But the main thing is that it's not needed for VSA (tick accuracy). Believe me, it's not necessary, that's all) I guess you don't trade yourself? You should know otherwise.
I do. My broker doesn't. And my neighbours in Scotland are even worse. They have a minute history of a fortnight at the most.
But the main thing is that it's not necessary for VSA (tick accuracy). Believe me, it's not necessary, that's all) I guess you don't trade yourself? You should know otherwise.
What are you talking about? You said there is no history, look for more - I looked for it - I found it. And maybe it's you who just don't know how to set up the terminal? How much is the max. bars in the window?
But the main thing is that it is not necessary for VSA (tick accuracy). Believe me, it's not necessary, that's all).
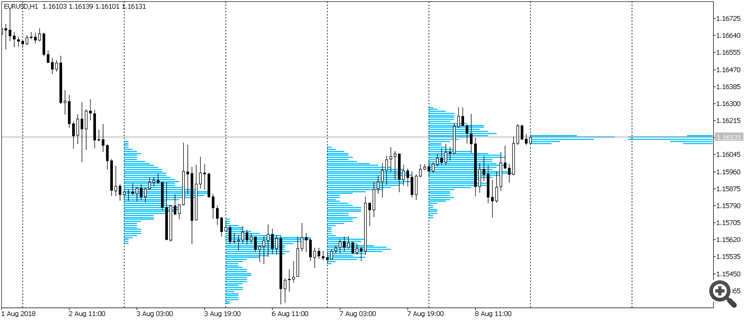
Here, by the way, is another indicator hello:
There is one VolChart indicator and one VolChart1 indicator on the chart. The set-files are in the archive.
I wrote that the article is NOT about indicators. That these are training indicators. Indicators demonstrate one of the ways of interacting with code, nothing else, they are not for real work. And you put these indicators into standard working conditions, that's all. And on this basis you claim that something is wrong. And they are not for this purpose, I repeat once again.
You answer the user above that the article is not about VSA. Well, yes, but it uses volumes as an example, which is certainly VSA related.
Here's how the simultaneous work of two indicators looks like for me. I just did it.
On the right, near the border of the VolChart1 window, the rest is VolChartI wrote that the article is NOT about indicators. That these are training indicators. Indicators demonstrate one of the ways of interacting with code, nothing else, they are not for real work. And you put these indicators into standard working conditions, that's all. And on this basis you claim that something is wrong. And they are not for this purpose, I repeat once again.
You answer the user above that the article is not about VSA. Well, yes, but it uses volumes as an example, which is certainly VSA related.
Here's how the simultaneous work of two indicators looks like for me. I have just done it.
On the right, near the border of the VolChart1 window, the rest is VolChartAndrei, I have already realised that the article is not about indicators. What is the article about? I am really curious. Here you write:
The proposed code, to the extent of my understanding and abilities, automates a very tedious process of building such charts. I decided to do it after I got tired of catching all sorts of errors with range overruns and so on.
Okay, we're interested in the manager. So, why don't you input correctly prepared data as an example (and you don't even tell us how to do it)? Why give it a secondary role? What makes you think your algorithm will work correctly in a combat environment if you didn't put it there? What makes you think that you won't have errors with graphics display, as I have now?
And instead of making a correct example - you now persist. Believe me, it says a lot about you as a developer. I showed you that there is an error - you sent me a screenshot that there is no error, without even specifying what I did to get the error...
I decided to do this after I got tired of catching all sorts of errors with out of range etc.
The errors are spot on.
I'm not the most persistent person, that's my weakness )
I've already answered the question of what the article is about. But I am ready to clarify once again.
The indicators that are given in the article are given as an example. They fulfil a single task - they show how to connect the file to be included and what happens after that. I was getting the same screenshots as yours while writing the article. This situation occurs with CHART_EVENT events and, of course, it is not allowed in a working indicator. Here it can't be an error, as I am quite sure. In the training indicators, the event handler is made, but without special frills, primitive. I didn't need more and I didn't take into account that these indicators will have to move intensively.
How to work with the code is in the article, you have not read it carefully. Two generated arrays should be fed to the input, I wrote about it. And I give a part of the code that shows how such arrays could be correctly created. Again, the article clearly says that less attention is paid to this particular part (creating arrays). Why? Because the main role is given to the include file. It is kind of a "constant" value. But the second part, where the problems with CHART_EVENT and so on should be solved, is a "variable" value. This part has to be changed every time. Today you need a glass, tomorrow a diagram, the day after tomorrow something else. That's why this part is given a secondary role, the developer will make this part of the code for himself. He will have his own event handlers and methods of creating arrays. And then you just need to add the file to be included. This is the scheme of work described in the article.
And the library file itself cannot be unchangeable either. And it can be edited, added, inherited from classes, etc. I'll tell you more, even if the developer throws out all my code and takes only the scheme "array preparation - manager - diagram", I will be quite satisfied. Although now, after your comments, this is unlikely to happen.
You emphasise what I decided not to dwell on in detail. I thought about it for quite a long time, made that decision and now I continue to stick to it, not out of stubbornness, but because I believe it is the right one. That is why I do not consider what you consider a mistake to be a mistake. That's the situation, unfortunately. It's not my stubbornness.
I have tested the algorithm itself in combat conditions and it works. I have similar indicators from other sites, other developers, and they show extremely close results to mine. The rounding is different and the scale is different, but that is not the point. Should I have mentioned it in the article? No, probably not.
The correct example you are talking about is a "combat" indicator based on this code. I am working on such an indicator and on the scheme I described. It will be later, but I'll be sure to post here when it's ready.
О! I didn't answer the very first question. The article is about a library file, in fact, a piece of code.
Alexey, I can hardly answer your questions more thoughtfully and carefully ) I really hope that I've been clear, understandable and honest.