Discussion of article "Horizontal diagrams on MеtaTrader 5 charts"
Why did they think of placing the include file in the directory with indicators instead of in the Include folder?
#include "HDiagsE.mqh"
and not in the Include folder?
When downloading from the site, the included file is opened in the Include folder - I had to replace the line in the indicator from
#include "HDiagsE.mqh"
to
#include <HDiagsE.mqh>
So that beginners do not bother with directories, but just throw all files into the folder with the indicator. As you can see, the archive does not provide the structure of unpacking folders.
So that beginners do not bother with directories, but just throw all the files into the folder with the indicator. As you can see, the archive does not provide the structure of unpacking folders.
That's how beginners will get caught on it. By steps: click on the included file - it is downloaded and displayed at the bottom of the browser - click on the downloaded file - the file is opened in MetaEditor (and MetaEditor has already placed the included file in the correct include directory).
That's exactly how newbies will get caught on this. By steps: click on the included file - it is downloaded and displayed at the bottom of the browser - click on the downloaded file - the file is opened in MetaEditor (and MetaEditor has already placed the included file in the correct include directory).
Do you really think that the way you download, everyone else downloads? I, for example, downloaded the archive first, then opened the indicator file and saw that the include file is in quotes. And the meta-editor did not put anything anywhere.
In general, useless dialogue. You can do it both ways, it is not something that needs to be discussed.
To be honest, I'd like to see a different implementation. Absolutely everything:
1. There is no implementation of drawing histograms on the canvas (respectively, there is no comparison of the speed of updating charts on the canvas and charts from graph primitives). Although, logically, if you write about horizontal histograms on MT5 charts, you should at least point to this method of drawing;
2. Why do you speak only about tick volumes? I, for example, would like very much to apply your indicator for real volumes, but it seems that I can't do it!?
3. As far as I understand, all charts are built to the "price/time" binding. No mention of pixel binding. And the implementation of histograms on that basis;
4. There is a question on this phrase: "Earlier it was mentioned in passing that for calculating the number of levels a better method will be used than just dividing the price interval into a given number of levels". Why is it better? 1, 10 и 100? Why not let the user set the number of levels themselves?
5. About the timer:
- The iTimer parameter contains the frequency of the timer triggering. When triggered, the creation of new candles is checked and the necessary actions are performed. We could put here the result of PeriodSeconds(SourcePeriod) call. However, the default value is one second, which is done in order to more accurately determine the moment when new candles appear.
Why start a timer and spend additional resources to determine the moment of appearance of a new candle? It can (and should) be done in OnCalculate(). And without calling the IsNewCandle() function every second (besides, it is so heavy);
6. When scrolling the chart with the diagram, artefacts pop out:
7. No mention that all this stuff will work on new builds (after 1881) because new i-functions are used;
8. The code is not commented at all - total disrespect to those who will try to modify your code for themselves. If you just open the files without an article - it will take a lot of time to understand everything;
9. When compiling indicator files - a warning pops up. Users may have questions;
10. "Do not forget that the attached indicators are intended for demonstration, training purposes and can not be used in real trading." - interesting feature. At the very end. Why can not be applied?
11. "In particular, attention should be paid to the fact that there should be no artefacts on the timeframe used as a data source." - I would also like to hear some clarification on this point. What "artefacts" we are talking about;
12. I almost forgot the most important thing. How is the correctness of the collected data guaranteed? You don't use CopyTicks(). Then how is the validation of correctness of the constructed levels performed?
And this, I'm sure, is not the whole list of problems.
In general, IMHO, it is an unsuccessful implementation for a tutorial article. It will be hard for beginners, while the experienced will write their own faster (and better).
I will try to answer all of them at once ))
Of course, the article is unlikely to offer something fundamentally new to experienced developers. The proposed code, to the best of my understanding and abilities, automates a very tedious process of building such diagrams. I decided to do it after I got tired of catching all sorts of errors with range overruns, etc.
I could have put the include file in include, but I decided not to clutter this folder, because everyone wants to put include files there).
Regarding canvas. I didn't do it because I can't say anything new about it. I have written a lot of very useful articles about drawing on canvas before me. I have come to the conclusion that this aspect has already been sufficiently covered.
Tick volumes are taken as an example. For the code it is important to pass a couple of arrays and that's all. For example, I will use this code to make a tumbler for a number of crypto exchanges.
Why there is no pixel binding. That's just the canvas side of things. And why there is no canvas, I answered.
Why the code is not commented out. It WAS commented out, but for use in conjunction with Doxygen. I had to remove it. And I would have had to comment in English, the code is not automatically translated, and I'm not good at that. Using google is not the best option, what will it translate?
Why is it not allowed to choose the number of levels? It's just not what the article is about. That's what the article says. The article is about drawing and managing arrays of graphical primitives, not about writing indicators. The developer will decide how to get the initial data. In the article I consider this task as secondary and, therefore, less important. A working indicator using this code will soon be in the market, but not here.
Training indicators cannot be applied in real trading because they depend on the state of the data source. In training indicators, it is assumed that the data source is in perfect condition. In life, this is not the case. In life, there are holes in timeframes, and I was thinking about them when I wrote about "artefacts". I never attach to my articles indicators that can be used for real trading, because I consider it wrong.
I do not use CopyTick here and consider it unnecessary. Perhaps it would make sense to draw a super-duper accurate chart on a canvas, but in this case, when quite serious rounding is used, it is not necessary.
I'll try to answer all of them at once ))
It turns out that you have written an "abstract thing" that works approximatedly, and even in an environment that does not exist in practice. There are no words.
And the rendering, as I pointed out above - crooked. Very good PR for your products.
So you wrote an "abstract thing" that works in an approximate way, and even in an environment that does not exist in practice. I'm speechless.
And the rendering, as I pointed out above, is crooked. Very good PR for your products.
No, it doesn't work.
And if there are no words, you don't need to write. You certainly don't know what you're writing about.
No, it's not working.
And if there are no words, you don't have to write. You certainly don't fully understand what you're writing about.
That's the end of it. Maybe I don't fully understand, it's just that under such a big title I'd like to see a lot more than what it is. Good luck.
- Free trading apps
- Over 8,000 signals for copying
- Economic news for exploring financial markets
You agree to website policy and terms of use
New article Horizontal diagrams on MеtaTrader 5 charts has been published:
Horizontal diagrams are not a common occurrence on the terminal charts but they can still be of use in a number of tasks, for example when developing indicators displaying volume or price distribution for a certain period, when creating various market depth versions, etc. The article considers constructing and managing horizontal diagrams as arrays of graphical primitives.
Let's use a well-known example to see how such diagrams might look:
Below is another example. The same diagrams drawn by graphical primitives:
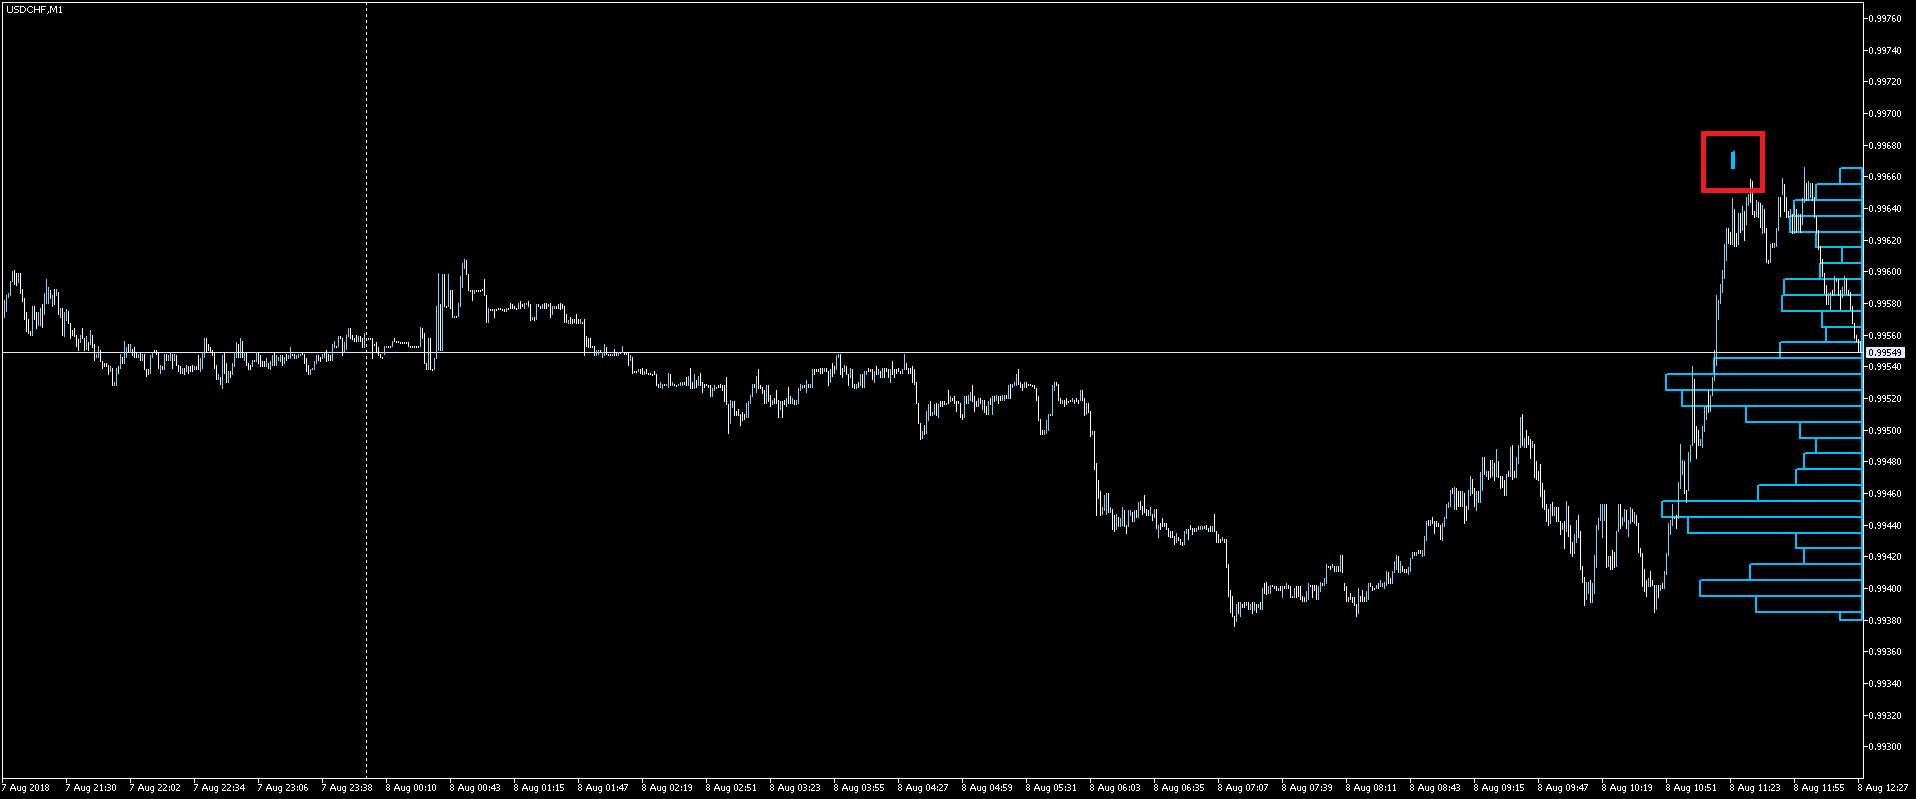
In this case, this is the indicator displaying tick volume distribution by days. This example shows quite clearly what tasks the developer has to solve:
Once again, we should note that there are several diagrams, which will further enable us to talk about an array of diagrams.
Below is a final example:
Author: Andrei Novichkov