Discussion of article "Reversal patterns: Testing the Double top/bottom pattern"
Where and how to download and install!?
1. Read the article
2. look at the table "Programmes used in the article". 2.
3. Download the archive "Attached files".
Good afternoon.
I trade the Mini Index and I really liked the article.
However, when I try to test it on the index in MT5, it generates zero results and I can't execute any trades.
Suppose I'm setting the wrong parameters for execution.
I'd like to see what the result would be if I ran it on Wing19.
Can you help me?
The market he is testing is forex, to use it on bmf you can use the code as a base and change it.
If you don't know how to edit the code, use the freelance area.

- www.mql5.com
In 'LimitTakeProfit.mqh' file :
4 errors,
'CSymbolInfo'- parameter passed as reference, variable expected, Line 55, Column 56
'CArrayLong'- parameter passed as reference, variable expected, Line 56, Column 56
'CArrayDouble'- parameter passed as reference, variable expected, Line 57, Column 56
'virtual'- unexpected token, Line 55, Column 1
1 advice,
deprecated behavior, hidden method calling will be disabled in a future MQL compiler version, Line 124, Column 21
Hello,
Thanks for this interesting article, but included MQL5 code canot be compiled, many errors :(
'CArrayLong' - parameter passed as reference, variable expected LimitTakeProfit.mqh 56 56
'CArrayDouble' - parameter passed as reference, variable expected LimitTakeProfit.mqh 57 56
'Create' - unexpected token, probably type is missing? ZigZag.mqh 72 10
and many more
Thanks
Hello,
You must to add
#include "SymbolInfo.mqh"
#include <Arrays\ArrayDouble.mqh>
#include <Arrays\ArrayLong.mqh>
form LimitTakeProfit.mqh
- Free trading apps
- Over 8,000 signals for copying
- Economic news for exploring financial markets
You agree to website policy and terms of use
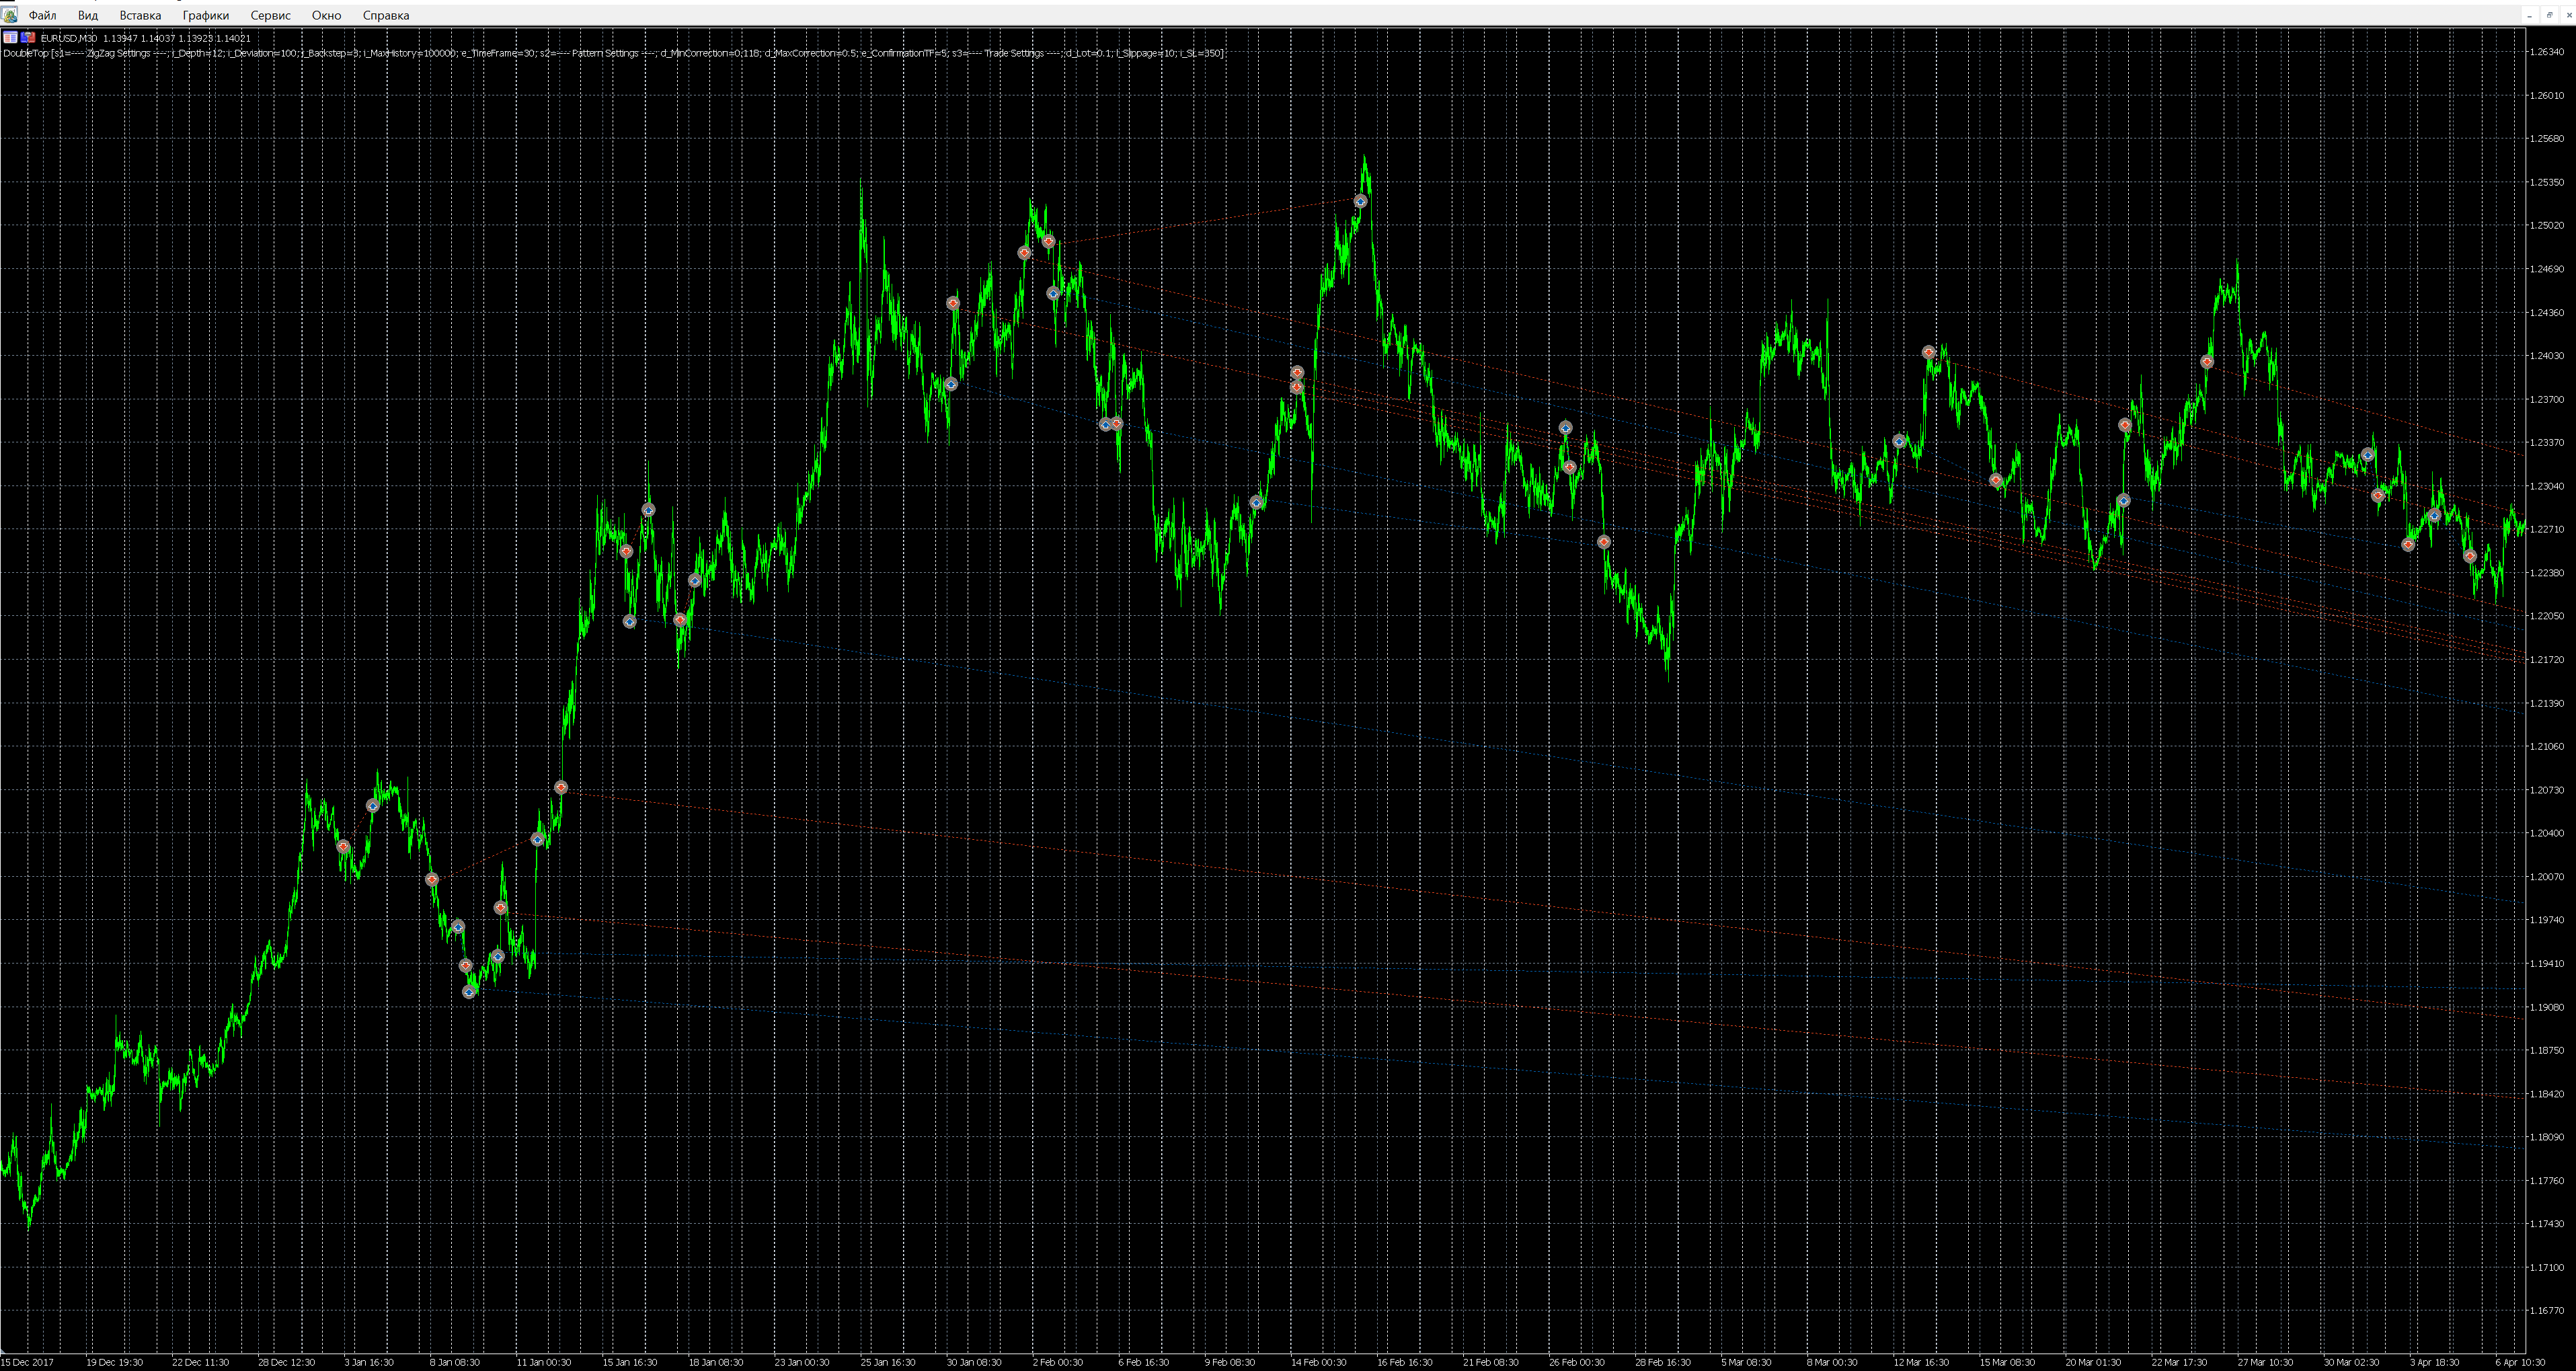
New article Reversal patterns: Testing the Double top/bottom pattern has been published:
Traders often look for trend reversal points since the price has the greatest potential for movement at the very beginning of a newly formed trend. Consequently, various reversal patterns are considered in the technical analysis. The Double top/bottom is one of the most well-known and frequently used ones. The article proposes the method of the pattern programmatic detection. It also tests the pattern's profitability on history data.
The Double top/bottom pattern can be found frequently on a price chart. Its formation is closely connected with the theory of trade levels. The pattern is formed at the end of a trend when the price meets a support or resistance level (depending on the previous movement). After a correction during a repeated testing of the level, it rolls back again instead of breaking through it.
At this point, counter-trend traders come into play trading a roll-back from the level and pushing the price towards correction. While the correction movement gains momentum, traders following the trend start exiting the market by either fixing the profit or closing loss-making positions that were aimed at breaking through the level. That strengthens the movement even further leading to the emergence of a new trend.
When searching for a pattern on a chart, there is no point in searching for the exact match of tops/bottoms. Deviation of top/bottom levels is considered normal. Just make sure the peaks are within the same support/resistance level. The pattern reliability depends on a strength of a level it is based on.
Author: Dmitriy Gizlyk