It would be great if one line was placed horizontally, another with a three times smaller period, and the centre line was left as it is.
Then the angle between the main line and the horizontal line, as well as between the main line and the line with a smaller period - there is a great tool for calculating the trend
It would be great if one line was placed horizontally, another with a three times smaller period, and the centre line was left as it is.
The angle between the main line and the horizontal line, as well as between the main line and the line with a smaller period, is an excellent tool for calculating the trend
Dear, you are confusing the linear regression channel with something else )
In fact, the regression line is one, the central one, and coefficients a and b are calculated for it, while the rest of the lines are at the discretion of the creator/user of the channel. Historically, they run parallel to the main one at some distance on either side. The distance is determined by the objectives. For example, it could be equal to 2*sigma (standard deviation, like the side lines in Bollinger Bands by default)...
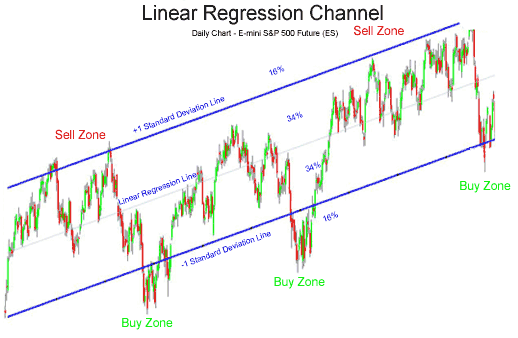
Similar to the 200-day Moving Average, large institutions often look at long term Linear Regression Channels. A Linear Regression Channel consists of three parts:
- Linear Regression Line: A line that best fits all the data points of interest.
- Upper Channel Line: A line that runs parallel to the Linear Regression Line and is usually one to two standard deviations above the Linear Regression Line.
- Lower Channel Line: This line runs parallel to the Linear Regression Line and is usually one to two standard deviations below the Linear Regression Line.
The multi-year chart of the S&P 500 exchange traded fund (SPY) shows prices in a steady uptrend and maintaining in a tight one standard deviation Linear Regression Channel:

The upper and lower channel lines contain between themselves either 68% of all prices (if 1 standard deviation is used) or 95% of all prices (if 2 standard deviations are used). When prices break outside of the channels, either:
- Buy or sell opportunities are present.
- Or the prior trend could be ending.
When price falls below the lower channel line, a buy signal is usually triggered.
Linear Regression Channel Sell SignalAn opportunity for selling occurs when prices break above the upper channel line.
Other confirmation signs like prices closing back inside the linear regression channel could be used to initiate buy or sell orders. Also, other technical indicators should be used to confirm.
Trend ReversalsWhen price closes outside of the Linear Regression Channel for long periods of time, this is often interpreted as an early signal that the past price trend may be breaking and a significant reversal might be near.
Linear Regression Channels are quite useful technical analysis charting tools. In addition to identifying trends and trend direction, the use of standard deviation gives traders ideas as to when prices are becoming overbought or oversold relative to the long term trend.
IndicatorsAlgorithms.mqh file?
Hi,
I've modified the code to add a parameter "Shift", this allows to calculate the channel in the past (Shift bars in the past, based on the last bar). This way one can quickly and optically verify strategies and / or entry points.
Collection
- Free trading apps
- Over 8,000 signals for copying
- Economic news for exploring financial markets
You agree to website policy and terms of use
Linear Regression Channel:
The indicator plots a channel using the linear regression model: y=b+a*x.
When calculation of regression coefficients (a and b) it uses only completed bars. The number of bars should be greater than 2 (and less than total bars in history-1), it is specified in InChPeriod input parameter. The indicator values for the last (uncompleted) bar is calculated using the values of calculated regression coefficients.
The recalculation of the regression coefficient is performed when total bars in the history has changed, for example, for the case of a new bar.
Author: mvv444