Discussion of article "Developing stock indicators featuring volume control through the example of the delta indicator"
Congratulations, Alexey!
Your indicator is working correctly)
Congratulations, Alexei!
Your indicator is working correctly)
Glad to hear it! That was the idea:)
Congratulations, Alexei!
Your indicator is working correctly)
How did you manage to check it?
How did you check?
By visual comparison.
How did you manage to check?
You can check it yourself! Just download the indicator and take a look. The total volume on the candlestick should be equal to the sum of buy and sell volumes. You can compare the volumes by opening the terminal data window "ctrl+d".
I don't understand a lot of things from the article, especially how a new tick can come, but there will be no new bar? I.e. a new bar is formed strictly after the appearance of a tick (not in parallel), or this process is completely asynchronous? How often does this situation arise, it is just generally accepted to check for the appearance of a new bar, if the trade goes on the opening of the bar, and here it turns out that this method will often (always?) lag?
I don't understand a lot of things from the article, especially how a new tick can come, but there will be no new bar? I.e. a new bar is formed strictly after the appearance of a tick (not in parallel), or this process is completely asynchronous? How often does this situation arise, it is just generally accepted to check for the appearance of a new bar, if the trade goes on the opening of the bar, and here it turns out that this method will often (always?) lag?
This situation can occur quite often. Again, download the indicator, enable logging and look for the following lines in the terminal log:
if(inpLog)
   Print(__FUNCTION__,": WARNING! The Tick of the Future ["+GetMsToStringTime(_ticks.GetTickTimeMs(i))+"]. Ticking time "+TimeToString(_ticks.GetTickTime(i))+
                      ", time[ rates_total-1 ]+PerSec() = "+TimeToString(time[rates_total-1]+PeriodSeconds()));
Regarding checking for the appearance of a new bar, as well as the use of an indicator from the Expert Advisor with control of the opening of bars. Everything will be exactly the same as with regular indicators. Just in the EA there should be a check (for the current symbol/period):
if( BarsCalculated( indicatorHandle ) != Bars( _Symbol, _Period ) )
   return;
In this case you will always get the indicator data only after the new bar is fully formed.
You can check it yourself! Just download the indicator and take a look. The total volume on the candlestick should be equal to the sum of buy and sell volumes. You can compare volumes by opening the terminal data window "ctrl+d".
I launched the indicator with default settings, but the retrospective calculation was made only for today's date - TF minutes - why is it so?
This situation can occur quite often. Again, download the indicator, enable logging and look for the following lines in the terminal log:
Regarding checking for the appearance of a new bar, as well as the use of an indicator from the Expert Advisor with control of the opening of bars. Everything will be exactly the same as with regular indicators. Just there should be a check (for the current symbol/period) in the Expert Advisor:
In this case you will always get the indicator data only after a new bar is fully formed.
I understand, the situation is frequent - what is the reason for this?
About the formed bar - no, I am just interested in how the EA can determine that a new tick of a potentially new bar has arrived, although the bar is not formed yet.
- Free trading apps
- Over 8,000 signals for copying
- Economic news for exploring financial markets
You agree to website policy and terms of use
New article Developing stock indicators featuring volume control through the example of the delta indicator has been published:
The article deals with the algorithm of developing stock indicators based on real volumes using the CopyTicks() and CopyTicksRange() functions. Some subtle aspects of developing such indicators, as well as their operation in real time and in the strategy tester are also described.
In the terminal, the real volume is indicated simply as Volume. It will be of interest to us. Since the terminal features tick history, as well as time and sales, it is now possible to develop stock indicators. They allow us to see what is happening "behind the scenes", i.e. what the real volume consists of: volume and frequency of executed trades, as well as the correlation of sellers and buyers at a certain time period. This means we can now expand the volume into components. These data can significantly improve the accuracy of our trading forecasts. At the same time, it is more difficult to develop such an indicator as compared to a usual one. This article thoroughly describes the sequence and subtleties of developing stock indicators, features of their work and testing. As an example, we will develop the delta (difference) indicator of buy and sell volumes that form the real volume. As the indicator is developed, the rules of working with the tick flow are to be described as well.
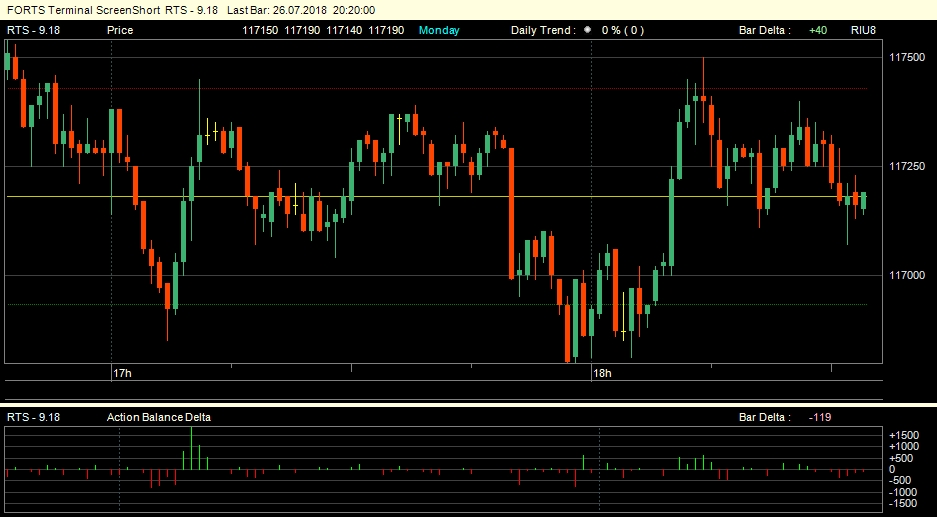
The final result is presented below. A blue bar shows the dominance of buyers on a certain candle, while a red one — the dominance of sellers.
Fig. 5. Delta indicator on RTS-6.18
The estimation of real volumes opens up new horizons for the stock market analysis allowing for better understanding of the price movement. This indicator is only a small part of what can be developed based on the tick data analysis. Creating stock indicators based on real volumes is quite a feasible task. I hope, this article will help you in creating such indicators and improving your trade.
Author: Alexey Kozitsyn