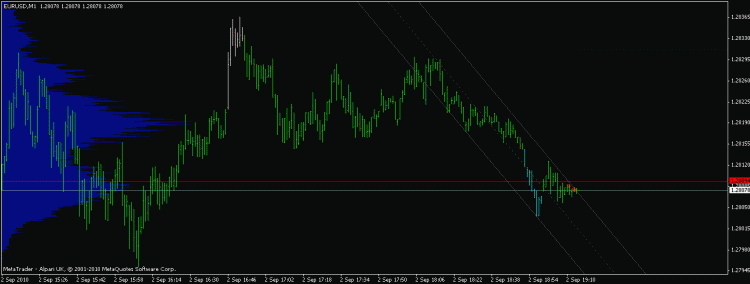
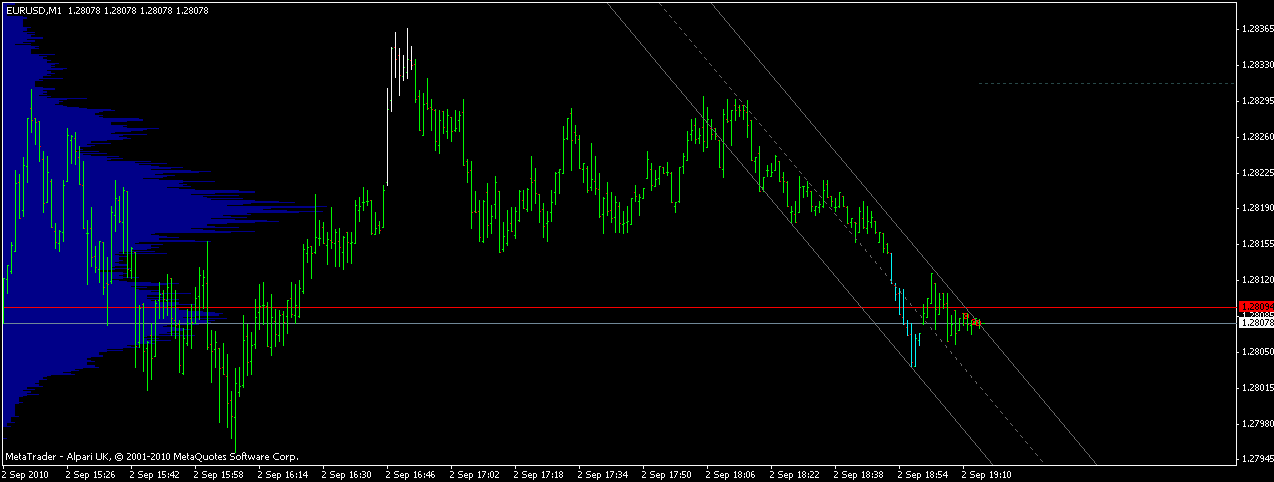
Indicators: Price Distribution
Very good job, I was implementing this myself. Just a minor comment, since there is alreay a graphic representation of the occurences, the numbee might be redundant since it is not possible to read it clearly, but overall... amazing!!
David
hi, i had the same idea ;)
i made a short look onto your code and it seem's to me that on a 5 digits broker your code will fail when the range is higher than 99pips. on a 4 digit broker it will fail after a range of 999pips.
but otherwise nice work.
//z
I would have done it like this (find attached).
#property copyright "David Alfonsi"
extern int NumOfBands=200;
int Count, BarsTotal;
double H,L, BandSize;
#property indicator_chart_window
//+------------------------------------------------------------------+
int init()
{
H = WindowPriceMax();
L = WindowPriceMin();
BandSize = (H - L) / NumOfBands;
BarsTotal = WindowBarsPerChart();
Clear();
}
//+------------------------------------------------------------------+
int start()
{
Clear();
for(int i=0;i<=NumOfBands;i++)
   {
   for(int j=0;j<=BarsTotal;j++)
       {
        double LR=L+i*BandSize;
        double HR=L+(i+1)*BandSize;

        double LB=iLow(Symbol(),NULL,j);
        double HB=iHigh(Symbol(),NULL,j);
        double CB=iClose(Symbol(),NULL,j);
        double OB=iOpen(Symbol(),NULL,j);

        if(LB>LR && LB<HR){Count++;}//Low in Band
        if(HB>LR && HB<HR){Count++;}//High in Band
        if(CB>LR && CB<HR){Count++;}//Close in Band
        if(OB>LR && OB<HR){Count++;}//Open in Band
        if(LB<HR && HB>LR){Count++;}//Crossing
       }
   if(Count>0){CreateBlock(i,Count);}
   Count=0;
   }
return(0);
}

//+------------------------------------------------------------------+
void CreateBlock(int i, int Count)
{
ObjectCreate("Block"+i,16,0,Time[BarsTotal-60]+Count*Period()*60,L+(i+1)*BandSize,Time[BarsTotal-60],L+i*BandSize);
ObjectSet("Block"+i,6,DarkBlue);
}
//+------------------------------------------------------------------+
int deinit()
{
Clear();
return(0);
}
//+------------------------------------------------------------------+
void Clear()
{
for(int k=0;k<=NumOfBands;k++){ObjectDelete("Block"+k);}
}
Thanks!I am searching it!thansk again!very good work!thanks again!
hi .
may i ask for what strategy it might help ?
i am instresting in vertical resherch : how many times the price was between price a and price b ?
this can help for range strategy for example .
hi .
may i ask for what strategy it might help ?
I was also looking into this, before I found your EA. This is a fantastic concept, however you can't just record however many times the numbers are in the same location, you have to "weight" them based on how accuratly they represent a Support or Resistance line, like are they sharp spikes, are they pin bars, did the candle stick or shadow close or open on the position, etc.
I would suggest weighting such as:
-Shadow closes on position = +5pts
-Candle Body Close/Open on position = +3pts
-Shadow move through position (but not candle body) = +2pts
Also, it is important to remember that Support and Resistance are not exact numbers, you should implement a +/- "width" factor like 5pips so we can build "overlaps", basically so we can "stack up" the S/R lines on themselves, rather than totally missing the line if one fell just 1pt off..
We should work together on this, ?
- Free trading apps
- Over 8,000 signals for copying
- Economic news for exploring financial markets
You agree to website policy and terms of use
Price Distribution :
Author: Kevin