Experts: BollTrade
Good concept, problem is this equity curve looks vey good but olny if you backtested around 2006 and mid 2007 , using recent dates from 2008 this turns completely negative, the picture below was done on 15 minute chart from January 1 2008. Perhaps if the variables of the Bollinger Bands could be optimizad it could produced the results like above.
Unfortunately, i have forgotten to lay out parameters of testing. And now i do not remember, how spent it.
But most likely you are right :)
hi, I am interesting with your EA, but I can't do trade with this EA.
Could u guide me for it, thanks a lot
Hi.
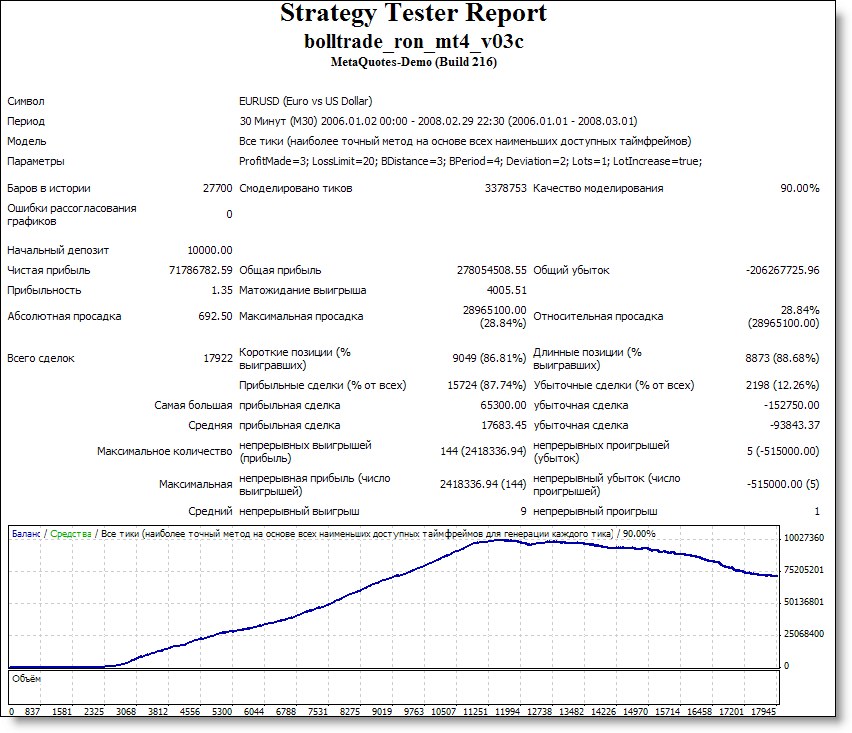
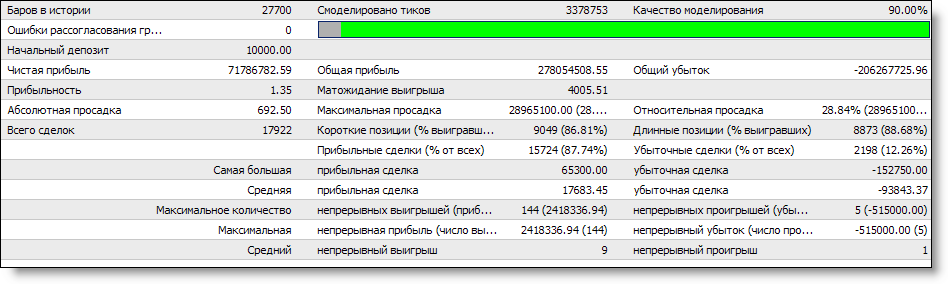
I have banished at myself on a tester, have stopped on such parameters:
Symbol: EURUSD
Period: M30
Model: All tics
Date: 2006.01.01 - 2008.03.01
There is some guy with this same EA located here /en/code/9333 . He is posing as the author trying to sell the supposed full version. It's most likely a scam. Not at this site but at /en/code/9333
hi !!
i had downloaded this . to run this on my system, it ask to choose program on which i have to run it . which program is recommended ?? also how do i use it practically on my platform ?? i use mt4 platform to trade .
it would be favour, if any help is extended .
thank you !
swapnil1980(swapnil .s.)
- Free trading apps
- Over 8,000 signals for copying
- Economic news for exploring financial markets
You agree to website policy and terms of use
BollTrade :
Author: John Smith