Chart horizontal grid line values?
MT4 grid aims to keep the same squares, not the values between grid lines like some other platforms. If you rescale the chart these lines will change.
Squares change.
Gotta be a way to get the Y Scale values that are in main chart current view.
The grid is just a fixed pixel amount. Nothing to do with price or time. Turn it off and ignore it.
If you want a price grid look in the codebase.
The grid is just a fixed pixel amount. Nothing to do with price or time. Turn it off and ignore it.
If you want a price grid look in the codebase.
First thanks thanks a lot for your help.
Of note is that Grid toggled on or off makes absolutely no difference as these numbers/price values are there regardless of the grid being toggled on or off. We can appreciate this in the following screen.
The distance between these numbers does change with time. When we are zoomed in to the max in AUDUSD (latest tick) 1 minute for example, sometimes the distance between these values is just 5 points (pippettes), sometimes 15, sometimes 25, or more even I've seen.This leads me to believe that these values have something to do with the market liquidity or something like that for the present time because they do change in terms of the distance between them.
If we zoom all the way out and mouse scroll farthest out, they never change though, as it is a pixel/display based thing like you said.
Its all perspective.
Anyway, regardless of how these numbers form or anything, is there any way at all to just retrieve them for current view? Got to be a formula for the chart to draw them or something in the first place There has to be a way to retrieve these values circled in red.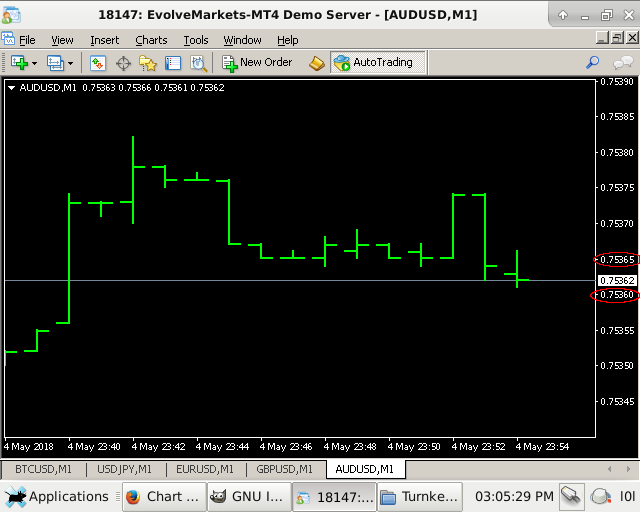
Ill try to just subtract the WindowPriceMax() and WindowPriceMin()and manually generate a list of how it allots the points for example if the difference is 200 its 20 pts if the difference is 100 its 10 pts if its 50 its 5 pts between the vertical scale values. From this we can sort of construct the vertical scale in current view.

Squares are in pixels. You may get size of chart in pixels, divide by pixels in a square thus getting a number of squares then divide price max minus price min to number of squares and start building grid from the middle.
But there is no point, this grid is just for orientation, it doesn't mean anything and it changes every time the chart is rescaled or resized.
Only if the size of the chart is 10 * grid size in pixels. Change the chart size, grid size does not change.
Thanks for your invaluable insight.
You think Kypa's way is the absolute best to accomplish this in an EA instead of the manual jotting down the scale intervals/working from there method?
Would you go forward in this direction ?
Problem is that like I illustrate in the latest Kypo response I gave, the chart values are what I call "slimy", or change sometimes its 20 sometiems 25/35/whatever in same tick/vertical scale view like in pic.
The problem is that for example indicator data values are calculated with the same scale as the rest of the chart. if I use an external codebase indicator to draw some non default lines in there, will it also cover the indicator subwindows in a perfectly retrievable way for live EA? Ill need to re-evaluate my manual/visual strat to accomodate to the reality of a new scaled screen? I have yet to try out all of the methods. . .
Do you have any methodology that you would follow if you were to accomplish this exact task (retrieving exact in-view vertical scale values up and below current bid price), for whatever reason?
Thanks and can you or anybody else recommend a very good Grid Indicator for this task, insight/solution for building the in-view vertical scale grid values? this task that generates the exact data on chart for EA , or anything else, any more insight/tips?
Squares are in pixels. You may get size of chart in pixels, divide by pixels in a square thus getting a number of squares then divide price max minus price min to number of squares and start building grid from the middle.
But there is no point, this grid is just for orientation, it doesn't mean anything and it changes every time the chart is rescaled or resized.
Ill look into this, you think its better than Manual Jotting down all of the scale for every currency?
The thing is that sometimes its 25 points between the numbers at the vertical scale, and in the same view, a little beneath the 25 gap of points the next one can be 20 or 15 or 35 or something, really slimy like that.
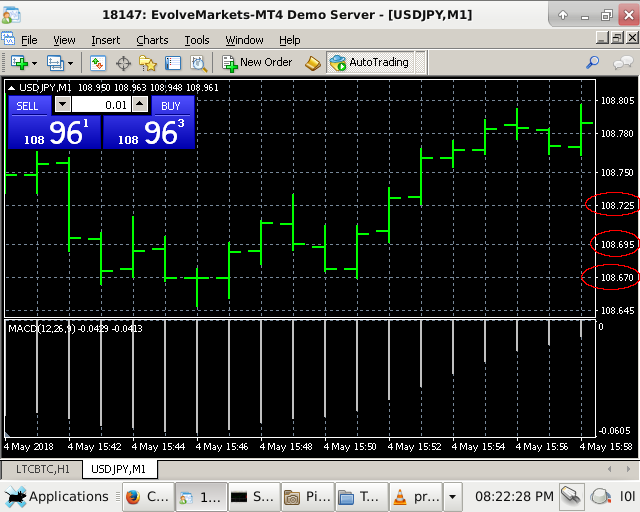
Its really weird sometimes like that, your method (and also mine) are limited to a fixed interval type calculation that is not the actual exact reality of what we have on screen.
These brokers use absolutely everything at their advantage even display like that kinda makes me tick, maybe I should check out CTRADER or something? I dont think so, however the lack of a good in built function is really really annoying.
So I guess we just cant get Main Chart Y Axis values in MT4, since an external solution (codebase, jotting down, Kypo Pixel Method, etc) would probably just not be the exact same thing (accurate) as the in-view, on-screen scale ever bc its "slimy" like that?
Id hate to lose money like that .
- Free trading apps
- Over 8,000 signals for copying
- Economic news for exploring financial markets
You agree to website policy and terms of use
As you can see, we need the value of the bottom and top "little-squares-predrawn-by-mt4" chart values closest to the actual current Bid price.
I tried WindowPriceMin() and Max functions and ChartPointsPerBar get as per https://docs.mql4.com/constants/chartconstants/charts_samples#chart_points_per_bar, everything on the chart constants. and can't find a way.
WindowPriceMin() and Max functions just give the very lowest value of the chart while I'm looking for a way to grab the values that are at the actual lines and specifically those closest to the actual current bid price.
Any ideas/code as to how to accomplish this? Thanks.