Discussion of article "A New Approach to Interpreting Classical and Hidden Divergence"
Probably, building automated TS on the basis of the selected (including indicators) is fundamentally wrong, even if the optimiser knows how to work with them.
And so, of course, it is necessary to create a bible that will make graphical objects visible to the Optimiser unnoticeably for the user.
Probably, building automated TS on the basis of the selected (including indicators) is fundamentally wrong, even if the optimiser could work with them.
And so, of course, it is necessary to create a bible that will make graphical objects visible to the Optimiser without being noticed by the user.
In the end, all these constructions are converted into + (buy) or - (sell). Just finish the indicators, so that they draw arrows or otherwise signal the Expert Advisor.
There should be no reliance on graphical objects at all, they should be used only for additional display, and everything should work the same way, whether these objects are drawn or not.
I once made an Expert Advisor in which the signals of the breakdown of trend lines forming a converging triangle were used for entry. I used the analytical equation for a straight line to calculate the value of the trend line and optimised it without any problems.
What's the argument? Any turkey line or anything else is a set of points. And it does not matter what mathematical bases were used in their construction. There is still a ghostly agreement on an article about the work of graphics in the tester. I will try to minimise this drawback.
What's the argument? Any turkey line or anything else is a set of points. And it does not matter what mathematical bases were used in their construction. There is still a ghostly agreement on an article about the work of graphics in the tester. I will try to minimise this drawback.
Please describe the work with several indicators, you can even use this screen
What's the argument about?
...
Here's what it's about:
The difficulty of evaluating strategies that work on graphical constructions in the strategy tester is that it is possible only in visualisation mode. No optimisation in automatic mode is possible. It is a labour-intensive and time-consuming process.
Please describe the work with several indicators, you can even from this screenshot
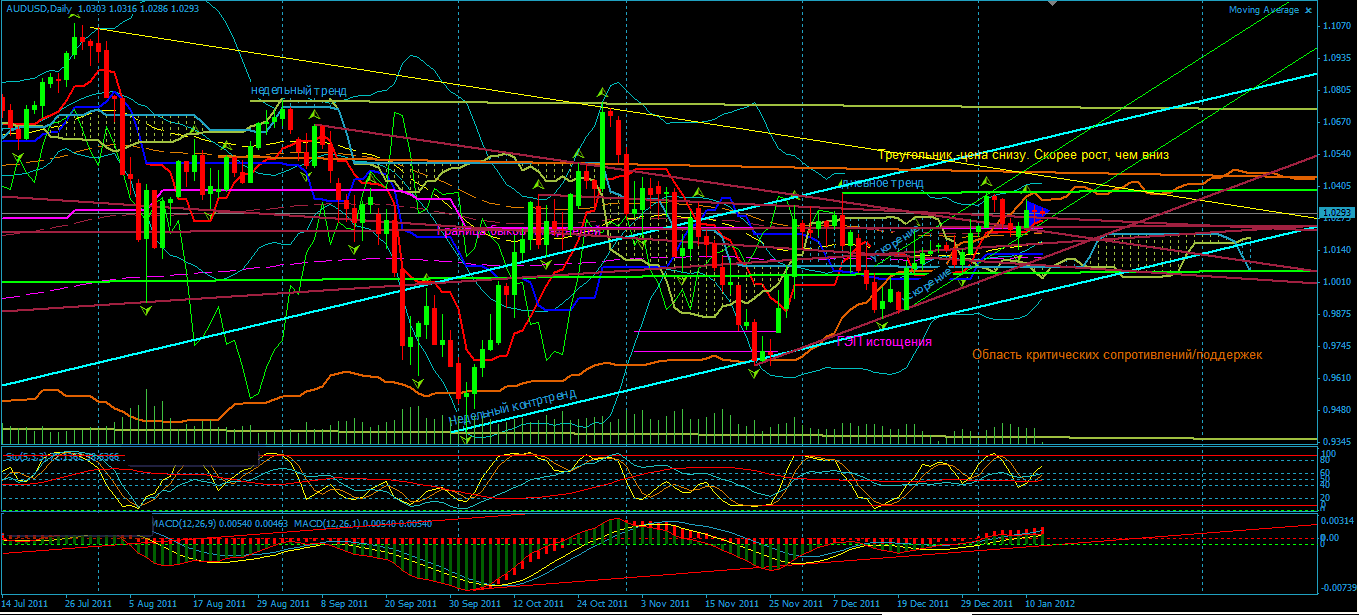
A gorgeous New Year's Tree!!! I understand the question was rhetorical? And if not, some of them are classics, some of them I know quite well (of course, we exclude classics), and some of them I can only guess what they are. If this is your strategy, I bow down to you. You are not trading on a daily chart as in the screenshot. The pennant at the end of the chart is obviously from another time frame. And the screen itself is from MT4? In MT5 there are problems with basements prescribed in the Expert Advisor. I would reduce such an abundance of lines by selecting the most important signals and write something simpler for myself. And here is another thing. In the article Considering in practice the adaptive method of following the market, a method of determining the market AFC was described. This method (with a small correction) is suitable for determining the value for any turkey. I myself use the programme of the author of the method for these purposes. It records any chart (indicator) in the form of points and can create not only an analogue of the indicator (of unknown author) but also if it is a wave to determine its period and by what method it is built.
About that:
I've written before that I've thought through how to fix this flaw ( and some other part of it ) of the tester. I'm getting the material ready. Just a matter of time.
In the end, all these constructions are converted into + (buy) or - (sell). Just finish the indicators so that they would draw arrows or otherwise signal the Expert Advisor.
There should be no reliance on graphical objects at all, they should be used only for additional display, and everything should work the same way, whether these objects are drawn or not.
- Free trading apps
- Over 8,000 signals for copying
- Economic news for exploring financial markets
You agree to website policy and terms of use
New article A New Approach to Interpreting Classical and Hidden Divergence has been published:
The article considers the classical method for divergence construction and provides an additional divergence interpretation method. A trading strategy was developed based on this new interpretation method. This strategy is also described in the article.
Hidden Divergence
In this figure, we can clearly see the upward market, but MACD has formed a new low, which is not confirmed by the price chart. This discrepancy hints at the presence of a hidden bullish divergence and indicates the strengthening of uptrend.
Author: Alexander Lasygin