Discussion of article "Implementing a Scalping Market Depth Using the CGraphic Library"
I used your class in my work, but the error of going outside the array did appear, but I didn't pay attention to it, because as a rule I started the glass when it was already filled, I will make your changes in it as well )) thanks for your work.
It is better not to make changes, but to use the one attached to the article. This and some other errors are fixed there. For example, the bet began to work normally when the number of buy or sell trading levels changes. It works even on an empty stack.
Yes, great. And the main thing is to make the prices in the glass be stationary, and only bid and ask move. It is more convenient to observe densities in the glass.
Try the ScaleTiksWithBook mode.
Vasily, great article! Thank you very much for your hard work, I found a lot of useful things for me. I especially liked the algorithm of paging and searching for new ticks (comparison of tick groups).
It's a shame that I can't check it in the Tester debugging mode - the tumbler event is not processed. In general, this is a significant drawback for testing robots, imho...
I have a small suggestion. What if we make a line on the chart for the last price in this form:
However, I'm not sure that the standard CGraphic class can draw such a line....
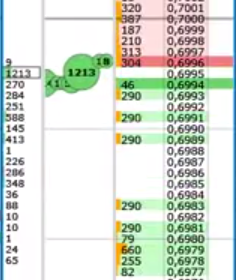
the idea is good, then it is necessary to add circles with lots passed, as in Bondar's drive. Very convenient.
the idea is good, then it is necessary to add circles with lots passed, as in Bondar's drive. Very convenient.
So the task is to implement an analogue of the Bondar drive? I guess there is no sense in this idea, because it is easier to use the ready-made functionality of the Bondar drive itself, and give MetaTrader what it is designed for, i.e. programming of trading systems ))).
Hi Vasiliy,
I really enjoyed the article, it opened my eyes. Please, write a follow up article on how to use the DOM for scalping. I am really interested in how you would approach scalping with this tool.
Thanks a million for this and all your other work.
Shep
I found your article very interesting. I will try to take inspiration from it to improve myself. Thank you
Can you tell me how to find the price of the maximum volume in the glass in your implementation? I found the volume itself, everything is clear, but how to find its price on which this maximal density stands.
- Free trading apps
- Over 8,000 signals for copying
- Economic news for exploring financial markets
You agree to website policy and terms of use
New article Implementing a Scalping Market Depth Using the CGraphic Library has been published:
In this article, we will create the basic functionality of a scalping Market Depth tool. Also, we will develop a tick chart based on the CGraphic library and integrate it with the order book. Using the described Market Depth, it will be possible to create a powerful assistant tool for short-term trading.
The introduction of new possibilities allowed to greatly modernize our previous Market Depth. Now, in addition to the order book, a tick chart with Last trades can be displayed in the new version:
Fig. 1. Market Depth with a tick chart.
Author: Vasiliy Sokolov