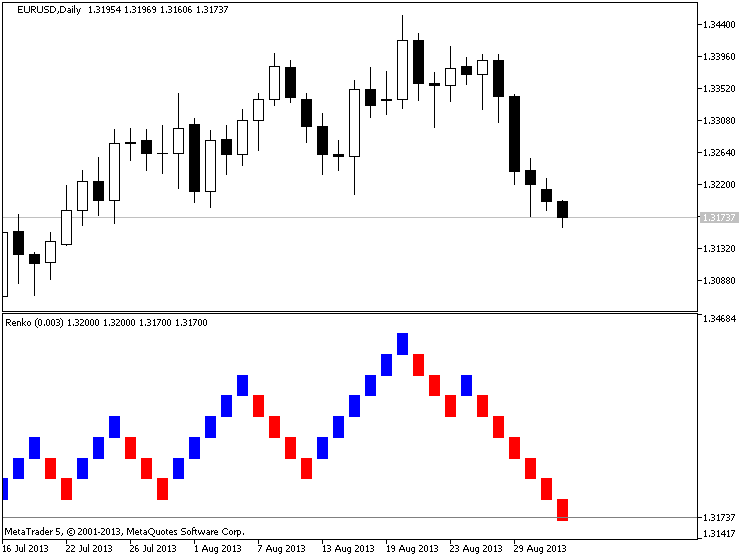
Indicators: Renko_v2
Forum on trading, automated trading systems and testing trading strategies
newdigital, 2013.09.03 11:03
Renko (extraction from Achelis - Technical Analysis from A to Z)
============
Overview
The Renko charting method is thought to have acquired its name from "renga" which is the Japanese word for bricks. Renko charts are similar to Three Line Break charts except that in a Renko chart, a line (or "brick" as they're called) is drawn in the direction of the prior move only if prices move by a minimum amount (i.e., the box size). The bricks are always equal in size. For example, in a 5-unit Renko chart, a 20-point rally is displayed as four, 5-unit tall Renko bricks.
Kagi charts were first brought to the United States by Steven Nison when he published the book, Beyond Candlesticks.
Interpretation
Basic trend reversals are signaled with the emergence of a new white or black brick. A new white brick indicates the beginning of a new up-trend. A new black brick indicates the beginning of a new down-trend. Since the Renko chart is a trend following technique, there are times when Renko charts produce whipsaws, giving signals near the end of short-lived trends. However, the expectation with a trend following technique is that it allows you to ride the major portion of significant trends.
Since a Renko chart isolates the underlying price trend by filtering out the minor price changes, Renko charts can also be very helpful when determining support and resistance levels.
Calculation
Renko charts are always based on closing prices. You specify a "box size" which determines the minimum price change to display.
To draw Renko bricks, today's close is compared with the high and low of the previous brick (white or black):
-
If the closing price rises above the top of the previous brick by at least the box size, one or more white bricks are drawn in new columns. The height of the bricks is always equal to the box size.
-
If the closing price falls below the bottom of the previous brick by at least the box size, one or more black bricks are drawn in new columns. Again, the height of the bricks is always equal to the box size.
If prices move more than the box size, but not enough to create two bricks, only one brick is drawn. For example, in a two-unit Renko chart, if the prices move from 100 to 103, only one white brick is drawn from 100 to 102. The rest of the move, from 102 to 103, is not shown on the Renko chart.
Forum on trading, automated trading systems and testing trading strategies
Expert Advisors: Renko Line Break vs RSI EA
newdigital, 2014.03.28 07:39
The 3 Step EMA and Renko Strategy for Trading Trends (based on dailyfx article)- Many Forex traders use weighted moving averages, called EMA’s, to trade currency pairs that are trending.
- Determine the direction of the dominant trend direction with a 200 period EMA.
- Use price crossing a 13 period MA as both an entry trigger and manual trailing stop
Developed in the 18th century in Japan to trade rice, Renko charting is a trend following technique. It is excellent for filtering out price “noise” so traders can catch a major part a given Forex trend. It was believed that the name “Renko” originated from the Japanese word ‘renga’ meaning ‘brick’.
Similar to Kagi and Point and Figure charting, Renko ignores the element of time used on candlesticks, bar charts, and line charts. Instead, Renko focuses on sustained price movement of a preset amount of pips.
For example, a trader can set the bricks for as little as 5 pips or as many as 100 or more. A new brick will not be formed until price has moved 100 pips. It could take 24 hours for a new brick to form or it could take just a few hours. However, no bricks will form until the preset limit is achieved.
Find the Trend Direction
Renko charts can incorporate many of the usual technical indicators like stochastics, MACD, and moving averages. Today’s strategy will marry up Forex Renko charts with a 200 Exponential Moving Average (EMA) to find trend direction. Very simply, if price is trading above its 200 EMA, then the trend is up. If price is trading below its 200 EMA, then the trend is down.
This filter will give us a directional bias much like a compass or GPS. We will look to only take long trades when the Renko bricks are trending above the 200 EMA. On the other hand, in a downtrend, if the Renko bricks are trending below the 200 EMA, then the trend down. Forex traders will only look to short the market. One of the biggest mistakes swing traders make is entering trades that go counter to the dominant trend.
When to Get In
After the dominant trend direction is determined, traders can use the simplicity of Renko charts with a single 13 period EMA as a ‘trigger’ to signal an entry in the direction of the major trend. First, wait for at least two green bricks to appear above the 13 EMA. Then enter long on the appearance of the second green brick above the 13 EMA.
Exiting for Profit and for Loss
Once a trader is “triggered” into the trade, a protective stop can be set one-brick size below the 13 EMA. As long as the bricks remain above the 13 EMA, we look to stay with the trend. Just as the 13 EMA can get you in a new trade, the same EMA can be used to stop out a winning trade locking in profits.
Traders will need to manually move the stop one brick-size below 13 EMA and the current price brick. You can see in the example above how the combination of Renko and the 13 EMA helps traders stay with the trend a longer time.
- Free trading apps
- Over 8,000 signals for copying
- Economic news for exploring financial markets
You agree to website policy and terms of use
Renko_v2:
The indicator implements a breakthrough system using the Renko channel.
When price exits the gray channel, the bar color changes to the color corresponding to trend direction.
Author: Nikolay Kositsin