tracing of stack call after abort
I would like to request a feature to dump out the stack trace after abort (when array out of index or zero divide). This is especially useful when an error happened in a common routine to trace the caller.
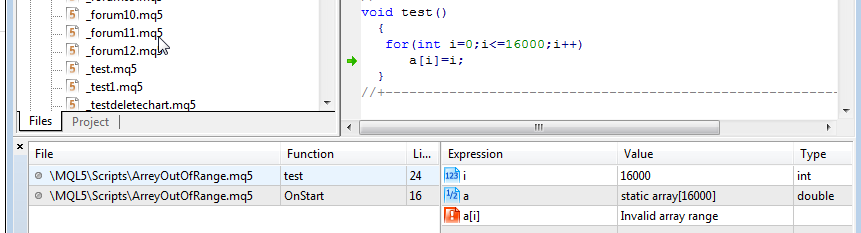
It has already worked but in debug mode only.
The problem is sometime you get array out of index and division by 0 unexpectedly while running and you dont know where to look for the error except only knowing the file name and the line number in the expert log.
But going into debugger trying to look for this error may be difficult because the error may only occur after going through thousands of codes.
I would like to request a feature to dump out the stack trace after abort (when array out of index or zero divide). This is especially useful when an error happened in a common routine to trace the caller.
For safety in the release compilation we do not have any information about functions(names,parameters types, etc.), so call stack would not be informative
When you start debugging from the MetaEditor, execution stops at the critical error with the possibility of switching to the editor to determine the cause.
- Free trading apps
- Over 8,000 signals for copying
- Economic news for exploring financial markets
You agree to website policy and terms of use
I would like to request a feature to dump out the stack trace after abort (when array out of index or zero divide). This is especially useful when an error happened in a common routine to trace the caller.