Libraries: A cross-platform library of original mathematical functions
Please implement ADF test and other tests to check cointegration.
Another goodie from fxsaber, thanks )
// The indicator shows the degree of similarity of each history interval with the current interval

#property indicator_separate_window

#property indicator_buffers 1
#property indicator_plots 1

#property indicator_minimum -1
#property indicator_maximum 1

#property  indicator_color1 clrRed
#property  indicator_type1 DRAW_LINE
#property  indicator_width1 2

sinput int Amount = 100; // Number of last bars (Pattern)

#include <fxsaber\Math\Math.mqh> // https://www.mql5.com/en/code/17982

double Buffer[];

void OnInit()
{
  SetIndexBuffer(0, Buffer);
}

int OnCalculate( const int rates_total,
                 const int prev_calculated,
                 const datetime &time[],
                 const double &open[],
                 const double &high[],
                 const double &low[],
                 const double &close[],
                 const long &tick_volume[],
                 const long &volume[],
                 const int &spread[] )
{
  if (rates_total > prev_calculated)
  {
    double Pattern[];

    ArrayCopy(Pattern, open, 0, rates_total - Amount, Amount);

    MathCorrelationPearson(open, Pattern, Buffer);

    const int Pos = ArrayMaximum(Buffer, 0, rates_total - Amount);

    Comment("The most similar stretch of history corresponding to the most recent (" +
          (string)time[rates_total - 1] + ") " + (string)Amount + "baram, it's here." +
          (string)time[Pos] + " - Pearson's IQ = " + (string)Buffer[Pos]);
  }

  return(rates_total);
}
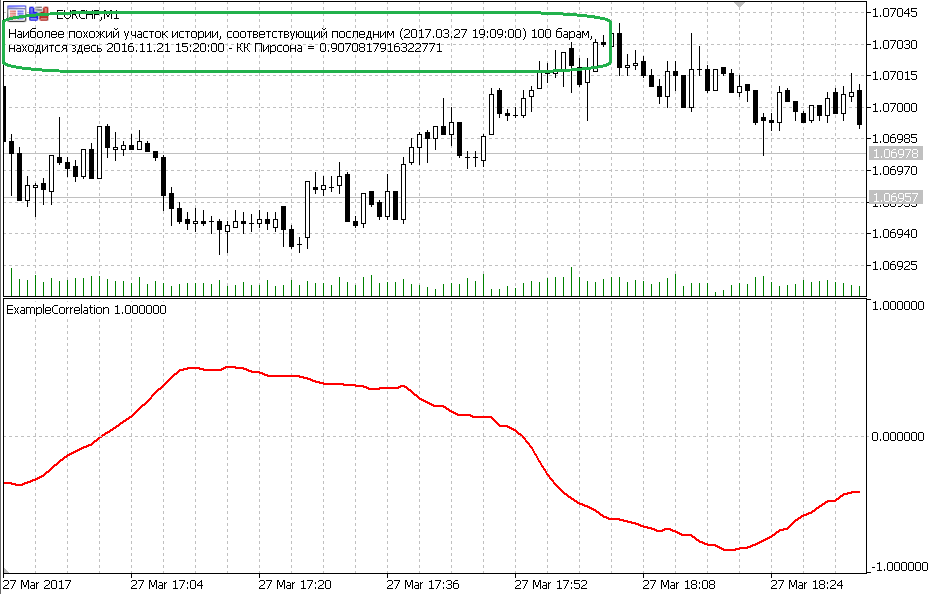
An example of how you can quickly find the most similar (according to Pearson) piece of history.
The strength of the implementation is only in the algorithm - much faster than any other.
fxsaber:
An example of how you can quickly find the most similar (according to Pearson) piece of history.
The strength of the implementation is only in the algorithm - much faster than any other.
On history, that's good. But I would like to do it the other way round, select several bar fragments on the history, and the indicator notifies us about it if it sees coincidences. Is such implementation possible in principle?
s22aa:
On the history, that's good. But I would like to do it the other way round, select several fragments of bars on the history, and the indicator notifies us about it if it sees coincidences. Is such implementation possible in principle?
A simple standard MathCorrelationPearson will be enough for this.
On the history, that's good. But I would like to do it the other way round, select several fragments of bars on the history, and the indicator notifies us about it if it sees coincidences. Is such implementation possible in principle?
fxsaber:
A simple in-house MathCorrelationPearson will suffice.
A simple in-house MathCorrelationPearson will suffice.
Well, that's just great. I have just started studying C++ on courses, I have already passed cycles and feel myself almost a programming guru, well, not quite a guru of course so halfway, a half-goose in a word. I think in a few years the standard MathCorrelationPearson will be "simple" for me too.
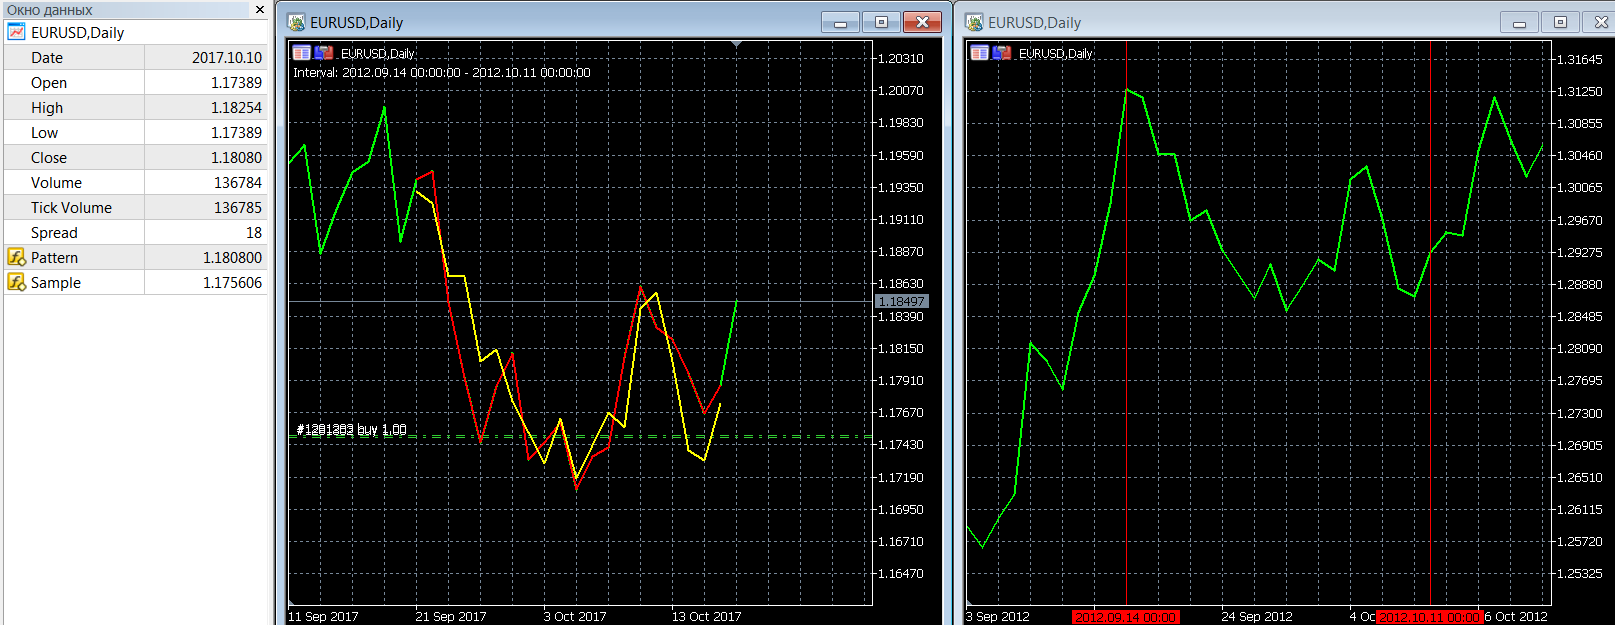
// Example of finding the "most similar" interval to the current one (Pearson's QC criterion).
#property indicator_chart_window

#property indicator_buffers 2
#property indicator_plots 2

#property  indicator_color1 clrRed
#property  indicator_type1 DRAW_LINE
#property  indicator_width1 2

#property  indicator_color2 clrYellow
#property  indicator_type2 DRAW_LINE
#property  indicator_width2 2

sinput int inAmount = 20;   // Number of last bars (Pattern)
input int  inMaxBars = 1 e5; // Number of bars to analyse

#include <fxsaber\Math\Math.mqh> // https://www.mql5.com/en/code/17982

double Buffer0[];
double Buffer1[];
double Buffer2[];
int handle;

const long handleChart = ChartOpen(_Symbol, PERIOD_CURRENT);

void OnInit()
{
  SetIndexBuffer(0, Buffer0);
  SetIndexBuffer(1, Buffer1);

  PlotIndexSetString(0, PLOT_LABEL, "Pattern");
  PlotIndexSetString(1, PLOT_LABEL, "Sample");

  ChartSetInteger(handleChart, CHART_MODE, CHART_LINE);
  ChartSetInteger(handleChart, CHART_AUTOSCROLL, false);
}

//------
// Taken from Include\Math\Stat\Math.mqh - https://www.mql5.com/ru/forum/97153/page15#comment_5927026

const double QNaN   =(double)"nan";   // QNaN.

//+------------------------------------------------------------------+
//| Computes the mean value of the values in array[] |
//+------------------------------------------------------------------+
double MathMean(const double &array[])
  {
   int size=ArraySize(array);
//--- check data range
   if(size<1)
      return(QNaN); // need at least 1 observation
//--- calculate mean
   double mean=0.0;
   for(int i=0; i<size; i++)
      mean+=array[i];
   mean=mean/size;
//--- return mean
   return(mean);
  }
//+------------------------------------------------------------------+
//| Computes the variance of the values in array[] |
//+------------------------------------------------------------------+
double MathVariance(const double &array[])
  {
   int size=ArraySize(array);
//--- check data range
   if(size<2)
      return(QNaN); // need at least 2 observations
//--- calculate mean
   double mean=0.0;
   for(int i=0; i<size; i++)
      mean+=array[i];
   mean=mean/size;
//--- calculate variance
   double variance=0;
   for(int i=0; i<size; i++)
      variance+=MathPow(array[i]-mean,2);
   variance=variance/size;
//--- return variance
   return(variance);
  }
//------

// Fits Sample to Pattern
void NormalizeArray( const double &Pattern[], double &Sample[], const bool Reverse = false )
{
  const double MeanPattern = MathMean(Pattern);
  const double MeanSample = MathMean(Sample);
  const double Koef = (Reverse ? -1 : 1) * MathSqrt(MathVariance(Pattern) / MathVariance(Sample));

  const int Total = ArraySize(Pattern);

  for (int i = 0; i < Total; i++)
    Sample[i] = (Sample[i] - MeanSample) * Koef + MeanPattern;
}

void MathLog( double &Array[] )
{
  for (int i = ArraySize(Array) - 1; i >= 0; i--)
    Array[i] = MathLog(Array[i]);
}

void MathExp( double &Array[] )
{
  for (int i = ArraySize(Array) - 1; i >= 0; i--)
    Array[i] = MathExp(Array[i]);
}

// Finds the best Sample by Pattern
int GetSample1( const int Amount, const double &Prices[], double &Sample[], double &Pattern[], int MaxBars )
{
  const int Total = ArraySize(Prices) - 1; // Remove the last bar from the calculations

  ArrayCopy(Pattern, Prices, 0, Total - Amount, Amount);

  MaxBars = (Total > MaxBars) ? MaxBars : Total;

  double Prices2[];
  ArrayCopy(Prices2, Prices, 0, Total - MaxBars, MaxBars);
  MathLog(Prices2);

  double Pattern2[];
  ArrayCopy(Pattern2, Pattern);
  MathLog(Pattern2);

  double Pearson[];
  MathCorrelationPearson(Prices2, Pattern2, Pearson);

  const int PosMax = ArrayMaximum(Pearson, 0, MaxBars - Amount);
  const int PosMin = ArrayMaximum(Pearson, 0, MaxBars - Amount);

  const bool Res = (MathAbs(Pearson[PosMax]) < MathAbs(Pearson[PosMin]));
  const int Pos2 = Res ? PosMin : PosMax;

  ArrayCopy(Sample, Prices2, 0, Pos2 - Amount + 1, Amount);
  NormalizeArray(Pattern2, Sample, Res);
  MathExp(Sample);

  return(Pos2 + Total - MaxBars);
}

void OnDeinit( const int )
{
  ChartClose(handleChart);
}

int OnCalculate( const int rates_total,
                 const int prev_calculated,
                 const datetime &time[],
                 const double &open[],
                 const double &high[],
                 const double &low[],
                 const double &close[],
                 const long &tick_volume[],
                 const long &volume[],
                 const int &spread[] )
{
  if (rates_total > prev_calculated)
  {
    double Pattern[];
    double Sample[];

    const int Pos = GetSample1(inAmount, close, Sample, Pattern, inMaxBars);

    // We've derived the pattern itself
    ArrayInitialize(Buffer0, EMPTY_VALUE);
    ArrayCopy(Buffer0, Pattern, rates_total - inAmount - 1);

    // Output Sample
    ArrayInitialize(Buffer1, EMPTY_VALUE);
    ArrayCopy(Buffer1, Sample, rates_total - inAmount - 1);

    Comment("Interval: " + (string)time[Pos - inAmount + 1] + " - " + (string)time[Pos]);

    // Show the found section
    const int Offset = 10;
    ChartNavigate(handleChart, CHART_BEGIN, Pos - inAmount + 1 - Offset); // Shift the chart by Offset bars before the start of the Sample source
    ObjectCreate(handleChart, "Left", OBJ_VLINE, 0, time[Pos - inAmount + 1], 0);
    ObjectCreate(handleChart, "Right", OBJ_VLINE, 0, time[Pos], 0);
  }

  return(rates_total);
}
There are similar things in the codebase.
You are missing trading opportunities:
- Free trading apps
- Over 8,000 signals for copying
- Economic news for exploring financial markets
Registration
Log in
You agree to website policy and terms of use
If you do not have an account, please register
A cross-platform library of original mathematical functions:
Author: fxsaber