Problems of a newbie in the "CUSTOM INDICATORS PROGRAMMING"
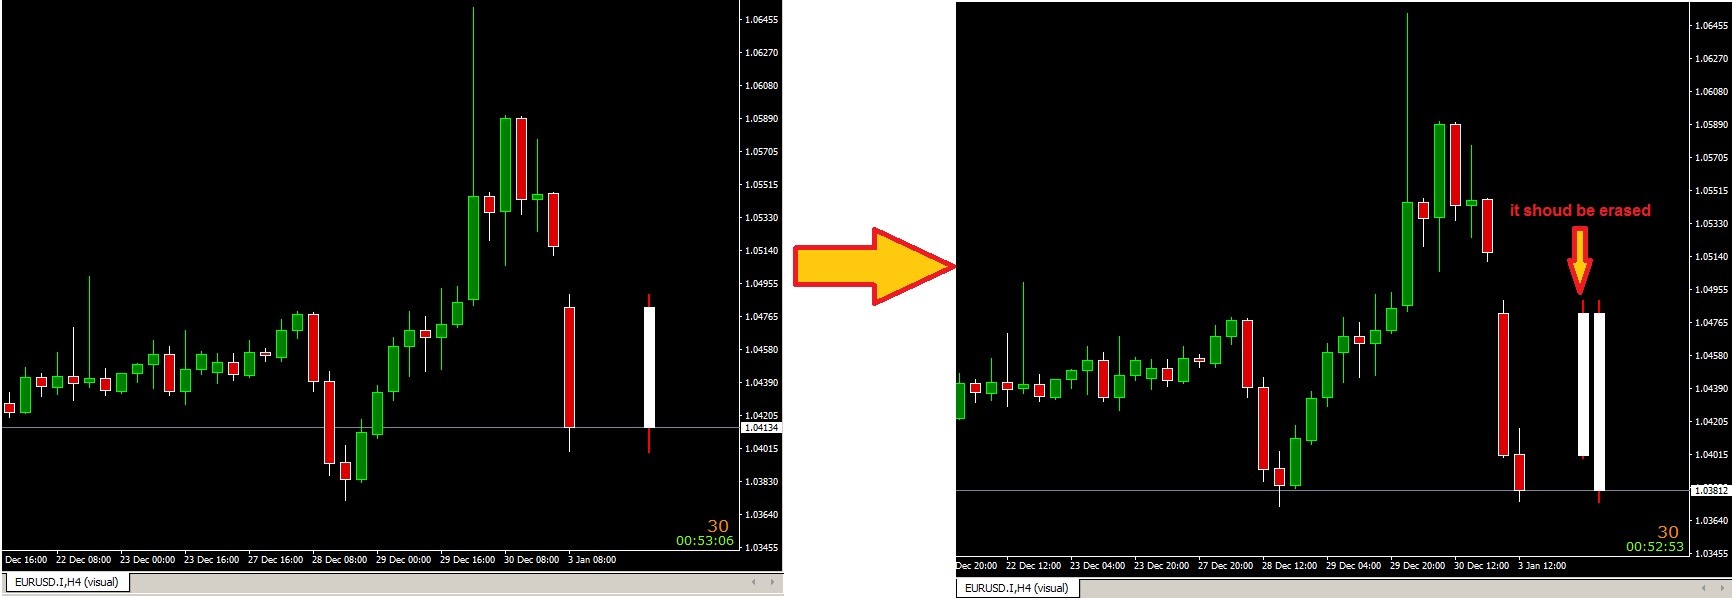
Here is a code for creating the day candle in every time frame shifted by 5 candle. the candle is create by 4 histogram. I want to erase the previous created candle when the new candle is coming or when the time frame is changed. how can i do it?
#property copyright "Ali Mojtabaei."
#property link      "https://telegram.me/mqlbyAliMojtabaei"
#property version   "1.00"
#property strict
#property indicator_chart_window

#property indicator_buffers 4
#property indicator_label1 "A"
#property indicator_label2 "B"
#property indicator_label3 "C"
#property indicator_label4 "D"

/*DECLEARATION BUFFER ARRAYS*********************************************/
double A[];
double B[];
double C[];
double D[];

/***********************************************************************/
int OnInit()
  {

   SetIndexStyle(0, DRAW_HISTOGRAM, STYLE_SOLID, 1 ,clrRed);
   SetIndexStyle(1, DRAW_HISTOGRAM, STYLE_SOLID, 1 ,clrRed);
   SetIndexStyle(2, DRAW_HISTOGRAM, STYLE_SOLID, 6 ,clrWhite);
   SetIndexStyle(3, DRAW_HISTOGRAM, STYLE_SOLID, 6 ,clrWhite);


   SetIndexBuffer(0,C);
   SetIndexBuffer(1,D);
   SetIndexShift(0,5);
   SetIndexShift(1,5);
   SetIndexBuffer(2,A);
   SetIndexBuffer(3,B);
   SetIndexShift(2,5);
   SetIndexShift(3,5);


   return(INIT_SUCCEEDED);
  }
//+------------------------------------------------------------------+
//| Custom indicator iteration function                              |
//+------------------------------------------------------------------+
int OnCalculate(const int rates_total,
                const int prev_calculated,
                const datetime &time[],
                const double &open[],
                const double &high[],
                const double &low[],
                const double &close[],
                const long &tick_volume[],
                const long &volume[],
                const int &spread[])
  {
//---

A[0]=iOpen(Symbol(),PERIOD_D1,0);
B[0]=iClose(Symbol(),PERIOD_D1,0);
C[0]=iLow(Symbol(),PERIOD_D1,0);
D[0]=iHigh(Symbol(),PERIOD_D1,0);

   return(rates_total);
  }
the problem is solved by adding some code...
int OnCalculate(const int rates_total,
                const int prev_calculated,
                const datetime &time[],
                const double &open[],
                const double &high[],
                const double &low[],
                const double &close[],
                const long &tick_volume[],
                const long &volume[],
                const int &spread[])
  {
A[0]=iOpen(Symbol(),PERIOD_D1,0);
B[0]=iClose(Symbol(),PERIOD_D1,0);
C[0]=iLow(Symbol(),PERIOD_D1,0);
D[0]=iHigh(Symbol(),PERIOD_D1,0);
   SetIndexDrawBegin(0,Bars-1);
   SetIndexDrawBegin(1,Bars-1);
   SetIndexDrawBegin(2,Bars-1);
   SetIndexDrawBegin(3,Bars-1);
//
   return(rates_total);
  }
Hi every one.
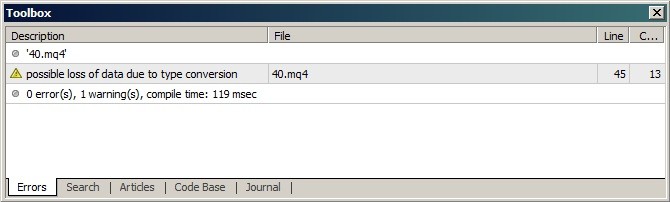
I wrote a simple code for illustration the volume of each bar (I know there is volume indicator in mt4 by default. i am writing the code to learn programming). but there is a warning while the code is compiled but no error. and nothing will be illustrated on the chart. where is the problem an how can i fix it.
//+------------------------------------------------------------------+
//|                                                           40.mq4 |
//|                                                   Ali Mojtabaei. |
//|                            https://telegram.me/mqlbyAliMojtabaei |
//+------------------------------------------------------------------+
#property copyright "Ali Mojtabaei."
#property link      "https://telegram.me/mqlbyAliMojtabaei"
#property version   "1.00"
#property strict
#property indicator_chart_window
#property indicator_buffers 1
double vol[];

//+------------------------------------------------------------------+
//| Custom indicator initialization function                         |
//+------------------------------------------------------------------+
int OnInit()
  {
IndicatorShortName("volume");
SetIndexBuffer(0,vol);
SetIndexStyle(0,DRAW_HISTOGRAM,STYLE_SOLID,2,clrRed);
   return(INIT_SUCCEEDED);
  }
//+------------------------------------------------------------------+
//| Custom indicator iteration function                              |
//+------------------------------------------------------------------+
int OnCalculate(const int rates_total,
                const int prev_calculated,
                const datetime &time[],
                const double &open[],
                const double &high[],
                const double &low[],
                const double &close[],
                const long &tick_volume[],
                const long &volume[],
                const int &spread[])
  {
   int prev=prev_calculated;
   int totalbars=rates_total;
   int limit=totalbars-prev;
   if (limit>0)
   limit--;
//---- main loop
   for(int i=0; i<=limit; i++)
      vol[i]=Volume[i];
   return(rates_total);
  }
//+------------------------------------------------------------------+
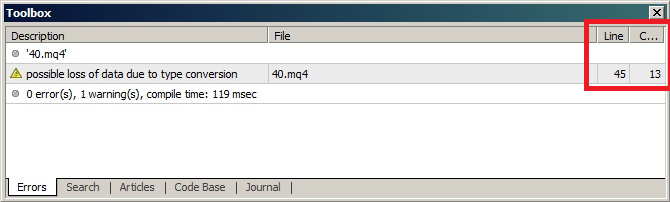
The warning message will tell you where the problem is located. In this case, Line 45, Character (column) 13.
There aren't 45 lines in the code you posted, so I'm guessing you cut some of it out.
The warning is because buffers are doubles, but volume is a long. You can read about the different data types here
You can suppress the warning by typecasting:
//---- main loop
   for(int i=0; i<=limit; i++)
      vol[i]=(double)Volume[i];
   return(rates_total);
The reason why you can't see anything is because you are displaying the information in the main (chart) window.
You need to change this:
#property indicator_chart_window
To this:
#property indicator_separate_window
- www.mql5.com
The warning message will tell you where the problem is located. In this case, Line 45, Character (column) 13.
There aren't 45 lines in the code you posted, so I'm guessing you cut some of it out.
The warning is because buffers are doubles, but volume is a long. You can read about the different data types here
You can suppress the warning by typecasting:
The reason why you can't see anything is because you are displaying the information in the main (chart) window.
You need to change this:
To this:
thanks a lot honest_knave.
The indicator is showing the histogram in new separate window now.
You're right. I have cut some and now edit the post.but if I change the type data of the vol[] array to long, there will be an error.
long vol[];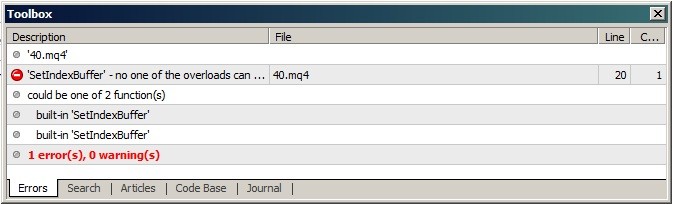
You can't do that - buffers must be doubles.
You need to typecast Volume, as I showed above.
Hi every one. How can i fix the problem.
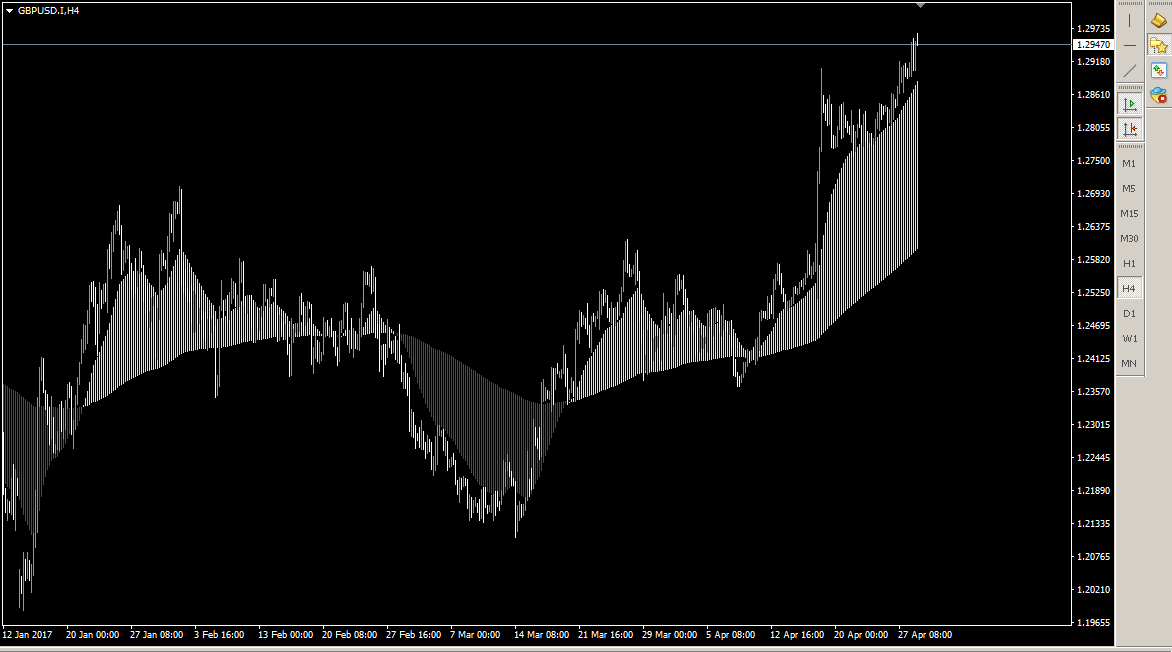
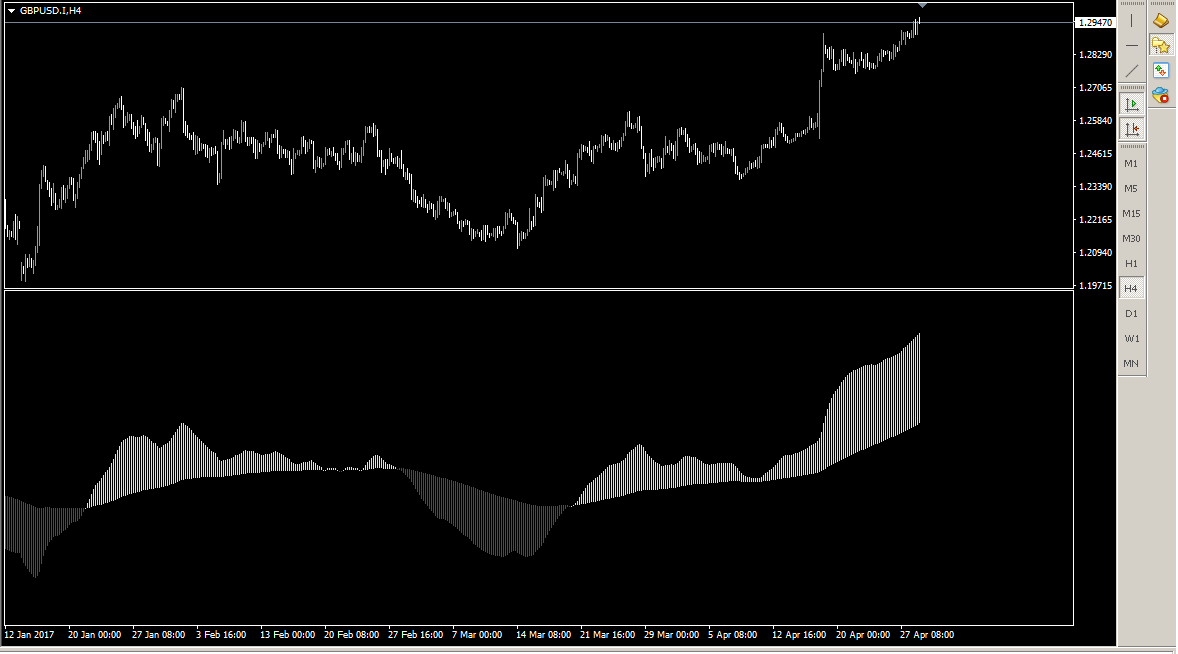
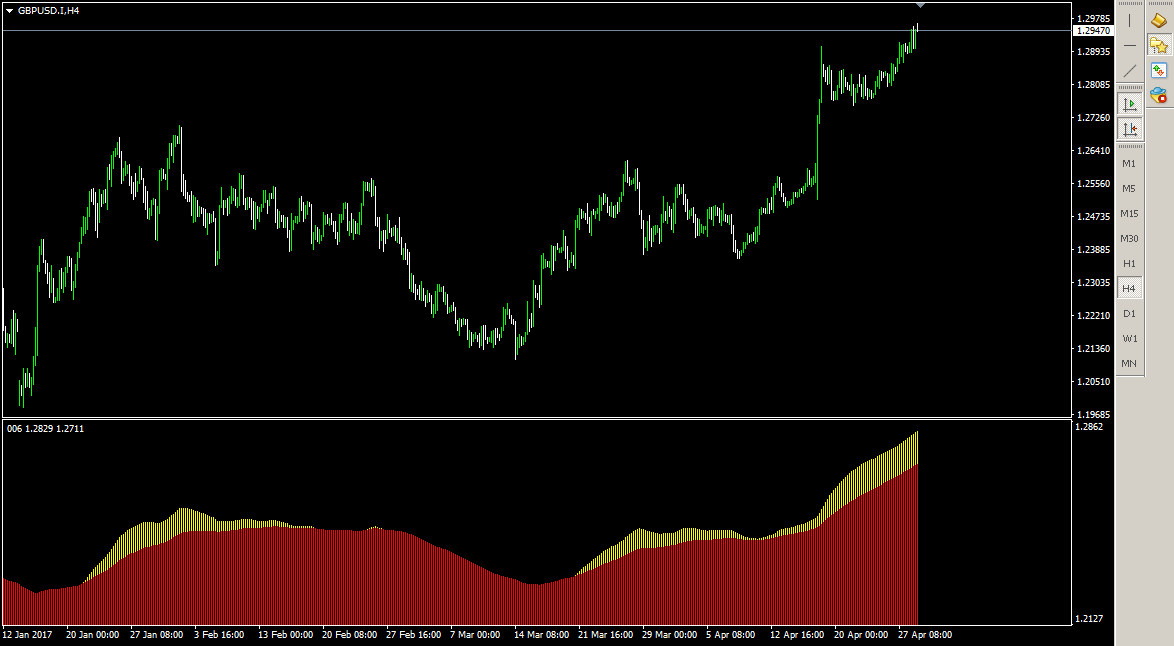
Here is an indicator that has two MA (Moving Average) buffers. I want to draw histogram between two buffers in separate window like the first figure but it draw complete histogram shown in second figure.
//+------------------------------------------------------------------+
//|                                                           41.mq4 |
//|                                                   Ali Mojtabaei. |
//|                            https://telegram.me/mqlbyAliMojtabaei |
//+------------------------------------------------------------------+
#property copyright "Ali Mojtabaei."
#property link      "https://telegram.me/mqlbyAliMojtabaei"
#property version   "1.00"
#property strict
#property indicator_chart_window
#property indicator_buffers 2
double A[], B[];
int i , limit;
//+------------------------------------------------------------------+
//| Custom indicator initialization function                         |
//+------------------------------------------------------------------+
int OnInit()
  {
SetIndexBuffer (0 , A);
SetIndexBuffer (1 , B);
SetIndexStyle (0 , DRAW_HISTOGRAM , STYLE_SOLID , 1 , clrYellow);
SetIndexStyle (1 , DRAW_HISTOGRAM , STYLE_SOLID , 1 , clrRed);
   return(INIT_SUCCEEDED);
  }
//+------------------------------------------------------------------+
//| Custom indicator iteration function                              |
//+------------------------------------------------------------------+
int OnCalculate(const int rates_total,
                const int prev_calculated,
                const datetime &time[],
                const double &open[],
                const double &high[],
                const double &low[],
                const double &close[],
                const long &tick_volume[],
                const long &volume[],
                const int &spread[])
  {
limit = (rates_total - prev_calculated);
if (prev_calculated == 0)
limit--;
for (i=0 ; i<=limit ; i++)
{
A[i]=iMA(Symbol(),PERIOD_CURRENT,10,0,MODE_SMMA,PRICE_TYPICAL,i);
B[i]=iMA(Symbol(),PERIOD_CURRENT,100,0,MODE_SMMA,PRICE_TYPICAL,i);
}
SetIndexDrawBegin(0,100);
SetIndexDrawBegin(1,100);
   return(rates_total);
  }
//+------------------------------------------------------------------+


It is working on chart window but not working correctly on separate window.
- Free trading apps
- Over 8,000 signals for copying
- Economic news for exploring financial markets
You agree to website policy and terms of use
I’m a newbie in mql programming so I will face with many troubles during learning. I decided to create a new topic for all future troubles going toward me or other newbies instead of creating new topics for each problem.
I beg other experienced and inexperienced programmers for help.
Thanks.