Request SnR Indicator Based On Volume
Trying to understand your counting and can not
Can you explain how do you count the number of bars above the ma?
Trying to understand your counting and can not Can you explain how do you count the number of bars above the ma?
Just because the count of bars above the MA is always changing frequently, then we trying to filter the count. The count based on a few bars that above the average of MA & the highest only. We need to have an options to input the amount of bars for the highest, perhaps 1 as a minimum value and 5 or more as a maximum value.
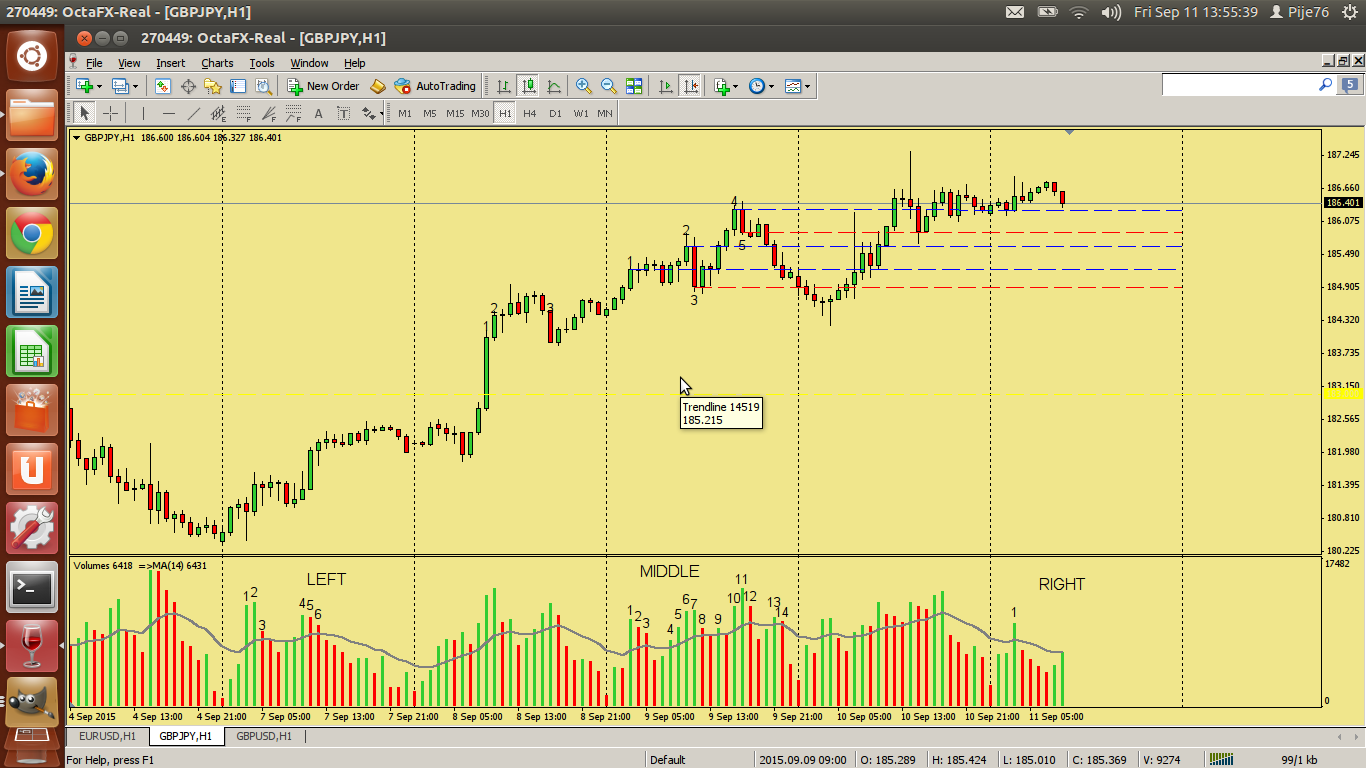
As you can see at the image, there's 6 bars above the MA in the left, there's 14 bars above the MA in the middle, and there's 1 bar above the MA in the right.
For examples:
- In the left, we have 6 bars above the average of MA and also we input 3 as a maximum value. So we has this filter: 3 bars above the MA which's the highest than another 3 bars. Then based on that, it will drawing 3 SnR lines only on 3 the candlesticks.
- In the middle, we have 14 bars above the average of MA and we input 5 as a maximum value. So we has this filter: 5 bars above the MA which's the highest than another 9 bars. Then based on that, it will drawing 5 SnR lines only on 5 the candlesticks.
The result:

*
- Maybe, we can ignore the colors of volume indicator. I changed the color from green & red into magenta to make it programming easily...
- We sorting the count of bars from highest to lowest firstly, as you can see at the images: in the left is (2,1,3) & the middle is (5,4,2,1,3).
- We draw the SnR lines on the candlestick based on the Open or Close or both of candlesticks. And draw a blue line or green or another colors for Bull candle and a Red line or another colors for Bear candle.
I'm sorry for my English language...
Trying to understand your counting and can not Can you explain how do you count the number of bars above the ma?
Or maybe we can create it based on the amount of the highest only and ignore the MA?
Let say, we input 5 as a value then the indicator will counting just 5 bars that more highest than another bars in the current day?
I've coded but still get problems, I can't draw the horizontal line. Also there's some bars that's not draw/count the highest volume as can see the geen circle at the image.
How to draw the horizontal line based on High/Low or Open/Close? How to draw the blue line on Bull candle and the red line on Bear candle?

This's the code:
#property indicator_chart_window
#property indicator_buffers 2
#property indicator_color1 Blue
#property indicator_color2 Red
#property indicator_width1 1
#property indicator_width2 1
#property indicator_style1 0
#property indicator_style2 0
extern int NumberOfBars = 500;
double HighLines[], LowLines[];
//+------------------------------------------------------------------+
//| Custom indicator initialization function |
//+------------------------------------------------------------------+
int init()
{
SetIndexBuffer(0,HighLines);
SetIndexStyle(0,DRAW_LINE,0,1,indicator_color1);
SetIndexLabel(0, "HighLines");
SetIndexEmptyValue(0, EMPTY_VALUE);
SetIndexBuffer(1,LowLines);
SetIndexStyle(1,DRAW_LINE,0,1,indicator_color2);
SetIndexLabel(1, "LowLines");
SetIndexEmptyValue(1, EMPTY_VALUE);
IndicatorShortName("SnRV");
return(0);
}
//+------------------------------------------------------------------+
//| Custom indicator deinitialization function |
//+------------------------------------------------------------------+
int deinit()
{
return(0);
}
//+------------------------------------------------------------------+
//| Custom indicator iteration function |
//+------------------------------------------------------------------+
int start()
{
double HighestVolume;
int Limit;
int counted_bars=IndicatorCounted();
if(counted_bars>0) counted_bars--;
if ( NumberOfBars == 0 )
NumberOfBars = Bars-counted_bars;
Limit=NumberOfBars;
for(int i=0; i<Limit; i++)
{
HighLines = Volume;
{
HighestVolume = Volume;
if (Volume == HighestVolume)
{
HighLines=0;
}
}
}
return(0);
}
Hello Moderator,
I would like to request for this thread.
Can you remove this thread from this forum please?
Thanks in advancedWhy ?
Hi Mladen,
This is a request for a custom SnR indicator based on volume at timeframe H1.
1. Draw a SnR level as a horizontal line based on a few histogram bars of volume which's above the average of SMA only.
2. Draw a SnR level as a horizontal line at Open/Close of each candlestick bars, if the current candlestick are bull then draw a Blue color as Resistance line at their Open/Close bars, vice a versa for a bear candlestick.
3. Draw a SnR level as a horizontal line from each candlestick bars until the end of the market.
4. Create an additional options for the Input parameters:
- There's options to choose Close, Open, or both for the candlestick bars.
- There's options to input the amount of histogram bars, perhaps 1 as a minimum and 5 as a maximum value.
- There's options to input Period, Method, color, style, & width for Moving Average that inside in Volume window.
- There's options to choose color, style, & width for the horizontal line.
I have attached an image with more detailed instructions.
I believe, this's one of a good strategy for an intraday trading!
I hope Mladen or someone can code it for free  and I'll explain the detail of strategy for someone who help me to create this indicator.
Please forgive me if my language is bad because English isn't my language.
CheersPlease Answer Mr.Mladen
Thanks
Why ?
Hi Mladen,
Because you take too long to reply my questions... just kidding  And now, finally you're reply my question
Since I'm very new in MQL4 programming then I've tried to create inidicator but I get problems.
- 1st step, I want to get highest volume on separate window for each day (H1 timeframe only) and then sort the 24 volume bars for 2 or 3 bars from highest to lowest only.
- 2nd step, I want to draw the horizontal line on the OHLC of candlestick bar on chart window based on 1st step.
For a moment, I want to create indicator for 1st step only... and after that, continue to 2nd step.
Now, I can get latest volume bar for each day (H1 timeframe) but I can't get all of 24 volume bars for each day.
How to get the last 24 volume bars for each day and then sort 24 volume bars for each day by descend for 2 or 3 volume bars which's the highest?

Here's my last code:
extern int NumberOfBars = 100;
extern int ControlOfBars = 24;
extern int NumberOfHighs = 3;
//double ArrayVolume[];
double ArrayVolume[][2]; //1st step: Define a two dimensional array
double HighestColor[];
int start()
{
int tahun = 0;
int bulan = 0;
int hari = 0;
int menit = 0;
int jam = 0;
int shift = 0;
int tjam=0, tmenit=0;
int timeframe = 1440;
string tanggal = "";
datetime currentbartime = 0;
double tVolume;
int Limit;
int counted_bars=IndicatorCounted();
//---- last counted bar will be recounted
if(counted_bars>0) counted_bars--; //always count the previous bar
if ( NumberOfBars == 0 )
NumberOfBars = Bars-counted_bars;
Limit=NumberOfBars;
while(Limit>=0)
{
tahun=TimeYear(Time[Limit]);
bulan=TimeMonth(Time[Limit]);
hari=TimeDay(Time[Limit]);
jam = TimeHour(Time[Limit]);
menit = TimeMinute(Time[Limit]);
tanggal = tahun + "." + bulan + "." + hari + " " + jam + ":" + menit;
currentbartime = StrToTime(tanggal);
shift = iBarShift(NULL,timeframe,currentbartime);
tjam = TimeHour(iTime(NULL,60,iBarShift(NULL,60,currentbartime)));
tmenit = TimeMinute(iTime(NULL,Period(),Limit));
//start at hour zero
if(tjam == 0 && tmenit == 0) //2nd step: Inside main loop, add condition here to check for Hour == 0
{
ArrayResize(ArrayVolume, Limit, 0);
tVolume=Volume[Limit];
for(int j=0; j<ControlOfBars; j++) //3rd step: Set up another "for loop" length = 24 as there are 24 candles in a day for H1
{
// 4th step: Populate the Array with volume and candle index
jVolume = Volume[j];
//we will need a counter to keep track of where we are in the candle array going right to left so IndexCount=i+j
//also we will need and int to populate the array Count
//HighestVolume[Count][0] = Volume;
//HighestVolume[Count][1] = IndexCount;
//then increment after each element
//Count++;
}//end of "j for" loop
ArraySort(ArrayVolume, WHOLE_ARRAY, 0, MODE_DESCEND); //5th step: Sort the Array
}//end of "if"
Limit--;
//6th step: Define a function to draw a trend line
}//end of "while"
for (int k=0; k<NumberOfHighs; k++)
//7th step: Set up a second "for loop" with the length equal to the number of highs to display on the chart with lines
{
//if (kVolume == 0);
//{
//then read the array elements
// Price1 = HighestVolume[k][0];
// Index1 = HighestVolume[k][1];
//8th step: call the draw trend line function using price and candle index as parameters to draw the trend line
Print("BarIndex",Limit," Volume: ",tVolume);
HighestColor[Limit]=tVolume;
//}
}//end of "k for" loop
return(0);
}
Can you help me to review my code please?
Thank you Mladen...
Hi Mladen,
Because you take too long to reply my questions... just kidding And now, finally you're reply my question
Since I'm very new in MQL4 programming then I've tried to create inidicator but I get problems.
- 1st step, I want to get highest volume on separate window for each day (H1 timeframe only) and then sort the 24 volume bars for 2 or 3 bars from highest to lowest only.
- 2nd step, I want to draw the horizontal line on the OHLC of candlestick bar on chart window based on 1st step.
For a moment, I want to create indicator for 1st step only... and after that, continue to 2nd step.
Now, I can get latest volume bar for each day (H1 timeframe) but I can't get all of 24 volume bars for each day.
How to get the last 24 volume bars for each day and then sort 24 volume bars for each day by descend for 2 or 3 volume bars which's the highest?
Here's my last code:
extern int NumberOfBars = 100;
extern int ControlOfBars = 24;
extern int NumberOfHighs = 3;
//double ArrayVolume[];
double ArrayVolume[][2]; //1st step: Define a two dimensional array
double HighestColor[];
int start()
{
int tahun = 0;
int bulan = 0;
int hari = 0;
int menit = 0;
int jam = 0;
int shift = 0;
int tjam=0, tmenit=0;
int timeframe = 1440;
string tanggal = "";
datetime currentbartime = 0;
double tVolume;
int Limit;
int counted_bars=IndicatorCounted();
//---- last counted bar will be recounted
if(counted_bars>0) counted_bars--; //always count the previous bar
if ( NumberOfBars == 0 )
NumberOfBars = Bars-counted_bars;
Limit=NumberOfBars;
while(Limit>=0)
{
tahun=TimeYear(Time[Limit]);
bulan=TimeMonth(Time[Limit]);
hari=TimeDay(Time[Limit]);
jam = TimeHour(Time[Limit]);
menit = TimeMinute(Time[Limit]);
tanggal = tahun + "." + bulan + "." + hari + " " + jam + ":" + menit;
currentbartime = StrToTime(tanggal);
shift = iBarShift(NULL,timeframe,currentbartime);
tjam = TimeHour(iTime(NULL,60,iBarShift(NULL,60,currentbartime)));
tmenit = TimeMinute(iTime(NULL,Period(),Limit));
//start at hour zero
if(tjam == 0 && tmenit == 0) //2nd step: Inside main loop, add condition here to check for Hour == 0
{
ArrayResize(ArrayVolume, Limit, 0);
tVolume=Volume[Limit];
for(int j=0; j<ControlOfBars; j++) //3rd step: Set up another "for loop" length = 24 as there are 24 candles in a day for H1
{
// 4th step: Populate the Array with volume and candle index
jVolume = Volume[j];
//we will need a counter to keep track of where we are in the candle array going right to left so IndexCount=i+j
//also we will need and int to populate the array Count
//HighestVolume[Count][0] = Volume;
//HighestVolume[Count][1] = IndexCount;
//then increment after each element
//Count++;
}//end of "j for" loop
ArraySort(ArrayVolume, WHOLE_ARRAY, 0, MODE_DESCEND); //5th step: Sort the Array
}//end of "if"
Limit--;
//6th step: Define a function to draw a trend line
}//end of "while"
for (int k=0; k<NumberOfHighs; k++)
//7th step: Set up a second "for loop" with the length equal to the number of highs to display on the chart with lines
{
//if (kVolume == 0);
//{
//then read the array elements
// Price1 = HighestVolume[k][0];
// Index1 = HighestVolume[k][1];
//8th step: call the draw trend line function using price and candle index as parameters to draw the trend line
Print("BarIndex",Limit," Volume: ",tVolume);
HighestColor[Limit]=tVolume;
//}
}//end of "k for" loop
return(0);
}
Can you help me to review my code please?
Thank you Mladen...Is that the whole code?
If yes, metatrader is treating it as an EA or a script (since none of the indicator properties is stated in the code). Neiter in the EA nor in the script, IndicatorCounted() is not going to work (that is a function specific to indicators)
If no (if that is not the complete code), please post the complete code
- Free trading apps
- Over 8,000 signals for copying
- Economic news for exploring financial markets
You agree to website policy and terms of use
Hi Mladen,
This is a request for a custom SnR indicator based on volume at timeframe H1.
1. Draw a SnR level as a horizontal line based on a few histogram bars of volume which's above the average of SMA only.
2. Draw a SnR level as a horizontal line at Open/Close of each candlestick bars, if the current candlestick are bull then draw a Blue color as Resistance line at their Open/Close bars, vice a versa for a bear candlestick.
3. Draw a SnR level as a horizontal line from each candlestick bars until the end of the market.
4. Create an additional options for the Input parameters:
- There's options to choose Close, Open, or both for the candlestick bars.
- There's options to input the amount of histogram bars, perhaps 1 as a minimum and 5 as a maximum value.
- There's options to input Period, Method, color, style, & width for Moving Average that inside in Volume window.
- There's options to choose color, style, & width for the horizontal line.
I have attached an image with more detailed instructions.
I believe, this's one of a good strategy for an intraday trading!
I hope Mladen or someone can code it for free and I'll explain the detail of strategy for someone who help me to create this indicator.
Please forgive me if my language is bad because English isn't my language.
Cheers