How To Get Highest Volume & Draw Horizontal Line At Open/Close
- Find the index to the start of day
- Find the index of the highest volume between start of day and 0
- Draw the line.
- Find the index to the start of day
- Find the index of the highest volume between start of day and 0
- Draw the line.
Hi WHRoeder, thank you for your answers. It's very usefull for me who newbie in MQL4.
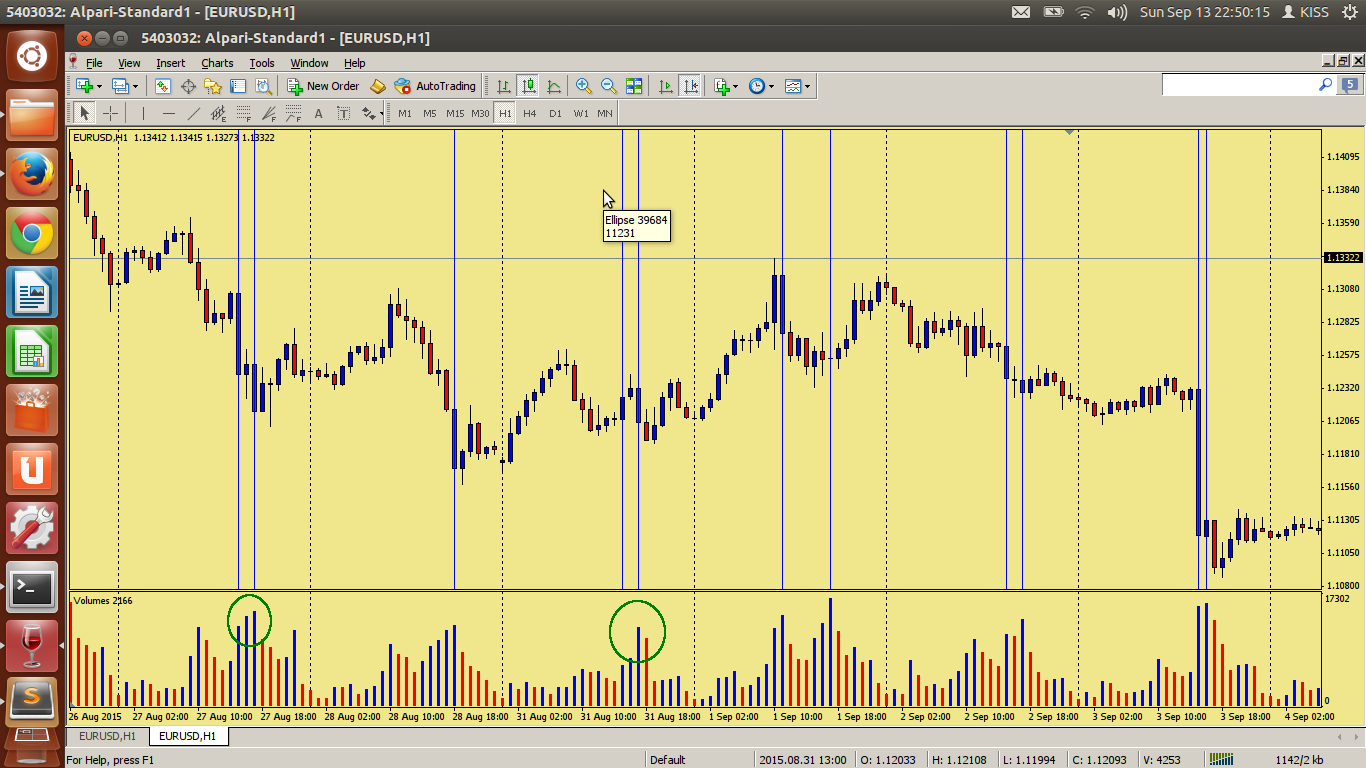
I've coded but still get problems, I can't draw the horizontal line. Also there's some bars that's not draw/count the highest volume as can see the geen circle at the image.
How to draw the horizontal line based on High/Low or Open/Close? How to draw the blue line on Bull candle and the red line on Bear candle?
This's the code:
#property indicator_chart_window
#property indicator_buffers 2
#property indicator_color1 Blue
#property indicator_color2 Red
#property indicator_width1 1
#property indicator_width2 1
#property indicator_style1 0
#property indicator_style2 0


extern int NumberOfBars = 500;
double HighLines[], LowLines[];

//+------------------------------------------------------------------+
//| Custom indicator initialization function                         |
//+------------------------------------------------------------------+
int init()
{
   SetIndexBuffer(0,HighLines);
   SetIndexStyle(0,DRAW_LINE,0,1,indicator_color1);
   SetIndexLabel(0, "HighLines");
   SetIndexEmptyValue(0, EMPTY_VALUE);

   SetIndexBuffer(1,LowLines);
   SetIndexStyle(1,DRAW_LINE,0,1,indicator_color2);
   SetIndexLabel(1, "LowLines");
   SetIndexEmptyValue(1, EMPTY_VALUE);

   IndicatorShortName("SnRV");

   return(0);
}


//+------------------------------------------------------------------+
//| Custom indicator deinitialization function                       |
//+------------------------------------------------------------------+
int deinit()
{
   return(0);
}


//+------------------------------------------------------------------+
//| Custom indicator iteration function                              |
//+------------------------------------------------------------------+
int start()
{
   double HighestVolume;

   int Limit;
   int counted_bars=IndicatorCounted();

   if(counted_bars>0) counted_bars--;
   if ( NumberOfBars == 0 )
   NumberOfBars = Bars-counted_bars;
   Limit=NumberOfBars;

   for(int i=0; i<Limit; i++)
   {
      HighLines[i] = Volume[i];
         {
            HighestVolume = Volume[iHighest(NULL,0,MODE_VOLUME,20,i)];
            if (Volume[i] == HighestVolume)
            {
               HighLines[i]=0;
            }
         }

   }

   return(0);
}
Your buffers are prices. what does it mean buffer[] = Volume[]?
WHRoeder, I still got problems. Can you help me please? I'm very beginner in MQL4 programming.
#property indicator_chart_window
extern int NumberOfBars = 500;
extern int ControlOfBars = 24;
extern int NumberOfHighs = 3;
extern color UpColor = Blue;
extern color DownColor = Red;
//+------------------------------------------------------------------+
//| Custom indicator initialization function                         |
//+------------------------------------------------------------------+
int init()
{
  return(0);
}

//+------------------------------------------------------------------+
//| Custom indicator deinitialization function                       |
//+------------------------------------------------------------------+
int deinit()
{
  return(0);
}

//+------------------------------------------------------------------+
//| Custom indicator iteration function                              |
//+------------------------------------------------------------------+
int start()
{
  double HighestVolume[NumberOfBars][NumberOfHighs];
  bool BullCandle = true;

  int Limit;
  int counted_bars=IndicatorCounted();

  //---- last counted bar will be recounted
  if(counted_bars>0) counted_bars--; //always count the previous bar
  if ( NumberOfBars == 0 )
  NumberOfBars = Bars-counted_bars;
  Limit=NumberOfBars;
  //Limit=NumberOfBars+1440/Period();

  for(int i=0; i<Limit; i++)
  {
    //Counting highest volume
    HighestVolume = Volume[iHighest(NULL, 0, MODE_VOLUME, ControlOfBars, i)];

    if (Volume[i] == HighestVolume)

    //Filtering the maximum of highest volume
    for(int j=0; j<NumberOfHighs; j++)
    {
      //Sorting highest volume
      ArraySort(HighestVolume, WHOLE_ARRAY, 0, MODE_DESCEND);

      //Drawing lines
      if (iClose(Symbol(), 0, i) - iOpen(Symbol(), 0, i)<0)
      {
        BullCandle=false;
        break;
      }
      if (BullCandle)
      {
        ObjectCreate(0,"UpColor",OBJ_HLINE,0, Time[0], UpColor);
        ObjectSet("UpColor",OBJPROP_COLOR,UpColor);
        ObjectSet("UpColor",OBJPROP_STYLE,STYLE_DASHDOT);
        ObjectSet("UpColor",OBJPROP_WIDTH,1);
      }
      else
      {
        ObjectCreate(0,"DownColor",OBJ_HLINE,0, Time[0], DownColor);
        ObjectSet("DownColor",OBJPROP_COLOR,DownColor);
        ObjectSet("DownColor",OBJPROP_STYLE,STYLE_DASHDOT);
        ObjectSet("DownColor",OBJPROP_WIDTH,1);
      }
    }
  }

  return(0);
}
  double HighestVolume[NumberOfBars][NumberOfHighs];


  HighestVolume = Volume[iHighest(NULL, 0, MODE_VOLUME, ControlOfBars, i)];
You declare HighestVolume as an array then try to give it a value without specifying [][]
You declare HighestVolume as an array then try to give it a value without specifying [][]
Please guys can you help me out on this code. I'm try to build a grid lines indicator but the lines are no drawing, here are the codes :
#define RS_LINES
//--- input parametersinput double GridMax=2.0;
input double GridMin=1.0;
input double GridStep=10.0;
input color GridColor=clrWhite;
input int GridBackground=clrBlack;
input int GridStyle =2;
double TickSize;
double pips;
double GridArray[];
//+------------------------------------------------------------------+
//| Custom indicator initialization function |
//+------------------------------------------------------------------+
int OnInit()
{
//--- indicator buffers mapping
TickSize = MarketInfo(Symbol(),MODE_TICKSIZE);
if(TickSize ==0.00001 || Point == 0.001)
pips= TickSize * 10;
else pips= TickSize;
//---
return(INIT_SUCCEEDED);
}
//+------------------------------------------------------------------+
//| Custom indicator iteration function |
//+------------------------------------------------------------------+
int deinit()
{
double RS_MAX = MathRound(GridMax / Point);
double RS_STEP = MathRound(GridStep/ Point);
double RS_MIN = MathRound(GridMin / Point);
double STEP_RANGE = (RS_STEP * pips);
int index= MathFloor(RS_MAX / RS_STEP);
for( int i= 1; i< index; i++)
{
GridArray[i] = RS_MIN + (i * STEP_RANGE ) ;
string RS_HGLineName = RS_LINES + DoubleToStr ( GridArray[i] , Digits ) ;
ObjectDelete( RS_HGLineName = RS_LINES + DoubleToStr ( GridArray[i] , Digits ));
}
return(0);
}
int start()
{
int counted_bars=IndicatorCounted();
double RS_MAX = MathRound(GridMax / Point);
double RS_STEP = MathRound(GridStep/ Point);
double RS_MIN = MathRound(GridMin / Point);
double STEP_RANGE = (RS_STEP * pips);
int index= MathFloor(RS_MAX / RS_STEP);
for( int i= 1; i< index; i++)
{
GridArray[i] = RS_MIN + ( i * STEP_RANGE ) ;
string RS_HGLineName = RS_LINES + DoubleToStr (GridArray[i] , Digits ) ; //< 46>
ObjectCreate ( RS_HGLineName , OBJ_HLINE , 0 , 0 , GridArray[i] ) ; //< 47>
ObjectSet ( RS_HGLineName , OBJPROP_COLOR , GridColor ) ; //< 48>
ObjectSet ( RS_HGLineName , OBJPROP_STYLE , GridStyle ) ; //< 49>
ObjectSet ( RS_HGLineName , OBJPROP_BACK , GridBackground ) ; //< 50>
}
//--- return value of prev_calculated for next call
return(0);
}
//+------------------------------------------------------------------+
I will really appreciate it if the code is corrected......
when i did it as a single variable it worked properly but when i then converted it to arrays,its stoped drawing horizontal lines, here is the Gridlines that worked as single variable :
#property strict
#property indicator_chart_window
#define RS_LINES
//--- input parameters
input double RSG_HGmax=2.0;
input double RSG_HGstep=50;
input double RSG_HGmin=1.0;
input color RSGI_HGcolor= 0;
input int RSGI_HGstyle=2;
input int RSGI_HGbackground=0;
double TickSize;
double pips;
//+------------------------------------------------------------------+
//| Custom indicator initialization function |
//+------------------------------------------------------------------+
int init()
{
TickSize = MarketInfo(Symbol(),MODE_TICKSIZE);
if(TickSize ==0.00001 || Point == 0.001)
pips= TickSize * 10;
else pips= TickSize;
return(0);
}
//+------------------------------------------------------------------+
//| Custom indicator iteration function |
//+------------------------------------------------------------------+
int deinit()
{
double RS_MAX = MathRound(RSG_HGmax / Point);
double RS_STEP = MathRound(RSG_HGstep/ Point);
double RS_MIN = MathRound(RSG_HGmin / Point);
double RS_PRICE ;
double I;
double STEP_RANGE = (RS_STEP *pips);
for( I=RS_MIN; I<RS_MAX; I+=STEP_RANGE)
{
RS_PRICE = I * Point;
string RS_HGLineName = RS_LINES + DoubleToStr ( RS_PRICE , Digits ) ;
ObjectDelete( RS_HGLineName = RS_LINES + DoubleToStr ( RS_PRICE , Digits ));
} // for
//---
return(0);
}
int start()
{
//---
int counted_bars=IndicatorCounted();
double RS_MAX = MathRound(RSG_HGmax / Point) ;
double RS_STEP = MathRound(RSG_HGstep/ Point);
double RS_MIN = MathRound(RSG_HGmin / Point);
double RS_PRICE ;
double J;
double STEP_RANGE = (RS_STEP *pips);
for(J=RS_MIN; J<RS_MAX; J+=STEP_RANGE)
{
RS_PRICE = J * Point;
string RS_HGLineName = RS_LINES + DoubleToStr ( RS_PRICE , Digits ) ; //< 46>
ObjectCreate ( RS_HGLineName , OBJ_HLINE , 0 , 0 , RS_PRICE ) ; //< 47>
ObjectSet ( RS_HGLineName , OBJPROP_COLOR , RSGI_HGcolor ) ; //< 48>
ObjectSet ( RS_HGLineName , OBJPROP_STYLE , RSGI_HGstyle ) ; //< 49>
ObjectSet ( RS_HGLineName , OBJPROP_BACK ,RSGI_HGbackground ) ; //< 50>
}
return(0);
}
//+------------------------------------------------------------------+
Waiting for your reply .....

Play video | Please edit your post. For large amounts of code, attach it. |
- Free trading apps
- Over 8,000 signals for copying
- Economic news for exploring financial markets
You agree to website policy and terms of use
How to get the highest volume (perhaps 1 bar or 2 bars only) in current day and then draw horizontal line at the close or open of candle?
Any help how to do this?
Many thanks