Hi to Low and Daily AV
pipsintheair:
Hello, i have an indicator that gives hi to low and daily average.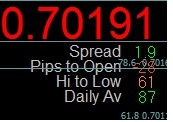
Hello, i have an indicator that gives hi to low and daily average.
Can somebody please explain what this means? As seen on the picture, thanks 
That is an average of nn days (depending on the parameters you use) of high-low range
Okay clear and what about the daily average why it is in red or green?
pipsintheair:
Okay clear and what about the daily average why it is in red or green?
Okay clear and what about the daily average why it is in red or green?
Without knowing the code (since it was posted only as ex4 here : https://www.mql5.com/en/forum/177278 ) my guess is that it depends on the current and previous averages of nn days : if the average is rising, green, if the average is falling, red
Ray Cooper:
It’s good. But, I seem moving average is more effective for measuring dynamic level.
It’s good. But, I seem moving average is more effective for measuring dynamic level.
How do you measure "dynamic level" with moving average?
You are missing trading opportunities:
- Free trading apps
- Over 8,000 signals for copying
- Economic news for exploring financial markets
Registration
Log in
You agree to website policy and terms of use
If you do not have an account, please register
Hello, i have an indicator that gives hi to low and daily average.
Can somebody please explain what this means? As seen on the picture, thanks