MT4 custom indicator programming request
Hi,
This is a request for a custom indicator. One of which I have not been able to find online or in this forum.
The indicator is based on tick volume delta.
1. Indicator showing tick volume delta as a histogram.
2. another showing tick volume delta correlations between certain currency pairs.
I have attached a word pad document with more detailed instructions.Anyone interested is free to have a look. 
Hope someone can code it for free :P ( guess I should be very lucky)
If not I am willing to pay to get this coded, if it comes down to this - hopefully I will get some reasonable quotes .
Since I am new to the coding side of things I am having a hard time figuring out what exactly is reasonable.Please forgive me if my request is in the wrong section.
Cheers
indicator_c.docxAs far as I am aware, tick volume delta can not be calculated for historical values using metatrader (there is nothing compared to bid and ask volumes in the historical data) and even the depth of market in metatrader 4 is not available from mql coding language (that could help in finding out bid and ask volumes for the current broker and symbol) - that simply does not exist in metatrader 4
Hi Mladen,
Appreciate your response very much.
Since I need to do some historical testing/studies the tick volume that I was looking for is not exactly 100 % tick volume i.e. it is a derivative. In short - the tick volume delta histogram needs to be calculated based on an existing indicator i.e. as per how the existing indicator calculates it.
These 2 indicators are publicly available via online search on forexfactory and forextsd. ( i downloaded them quite some time back)
The indicators are attached in this post. I also found 2 other files in my mt4 installation directory - I am not sure as to how they were formed or I do not remember whether the actual source files were downloadable at the time as I downloaded them long time back.
1. VSA div
It has some other functions also but I am just using the essential ones that enable me to just see the delta histogram.
I have included a screen shot of the settings that I use to just view the histogram.
2. Tick separate volume indicator.
Shows the upticks and down ticks separately
I am also thinking of combining the features of the 2 indicators into one i.e. in the interest of screen space and CPU. I have included a description of it in an additional word pad file i.e. indicator #3
mr.mladen please program this indicator...............

TRADERSM
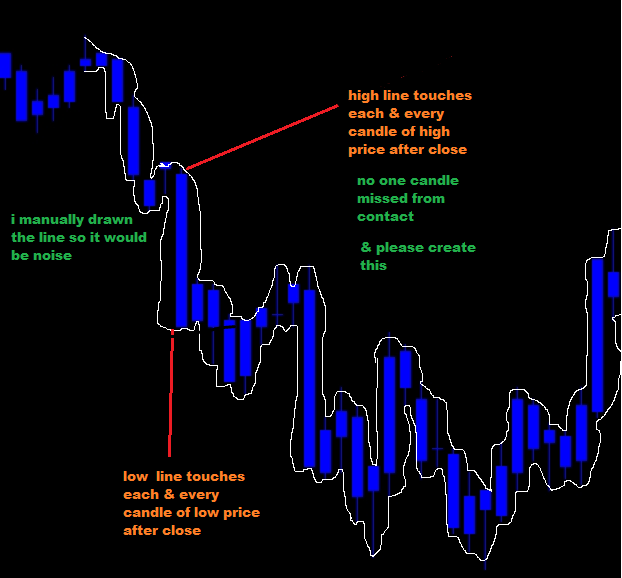
What are those lines?
mr.mladen first of all thankyou for quick response I try to create algorithmic trading ( i am not programer) i create ideas that works or not for checking
The line is upper and lower simple line each line draw after closing the before candle differ from moving average or any other indicator please create this.....i need it
Thankyou
mr.mladen first of all thankyou for quick response I try to create algorithmic trading ( i am not programer) i create ideas that works or not for checking
The line is upper and lower simple line each line draw after closing the before candle differ from moving average or any other indicator please create this.....i need it
ThankyouSorry but I do not understand the logic
Could you explain in some kind of mathematical way how are those lines calculated?
Sorry but I do not understand the logic Could you explain in some kind of mathematical way how are those lines calculated?
I am weak in mathamatics I simply explain that is (simple line draw after each candle close) Example moving average crossovers 14 , 23 etc.... i combine one MA With these lines or combine with any other extreme indicator..... i think there will be came new ideas
I am weak in mathamatics I simply explain that is (simple line draw after each candle close) Example moving average crossovers 14 , 23 etc.... i combine one MA With these lines or combine with any other extreme indicator..... i think there will be came new ideas
TRADERSM
Today I am a bit in the offside - will try something tomorrow
TRADERSM Today I am a bit in the offside - will try something tomorrow
Thankyou mr.mladen 
And Friends please give your suggestions & ideas...
I am afraid to tell but I do not understand the idea
- Free trading apps
- Over 8,000 signals for copying
- Economic news for exploring financial markets
You agree to website policy and terms of use
Hi,
This is a request for a custom indicator. One of which I have not been able to find online or in this forum.
The indicator is based on tick volume delta.
1. Indicator showing tick volume delta as a histogram.
2. another showing tick volume delta correlations between certain currency pairs.
I have attached a word pad document with more detailed instructions.Anyone interested is free to have a look.
Hope someone can code it for free :P ( guess I should be very lucky)
If not I am willing to pay to get this coded, if it comes down to this - hopefully I will get some reasonable quotes .
Since I am new to the coding side of things I am having a hard time figuring out what exactly is reasonable.Please forgive me if my request is in the wrong section.
Cheers
indicator_c.docx