Aberration of indicator line
When i scroll the roller to see back of chart, indicator attached aberrates.
1. What is the source of problem?
2. How can it solve?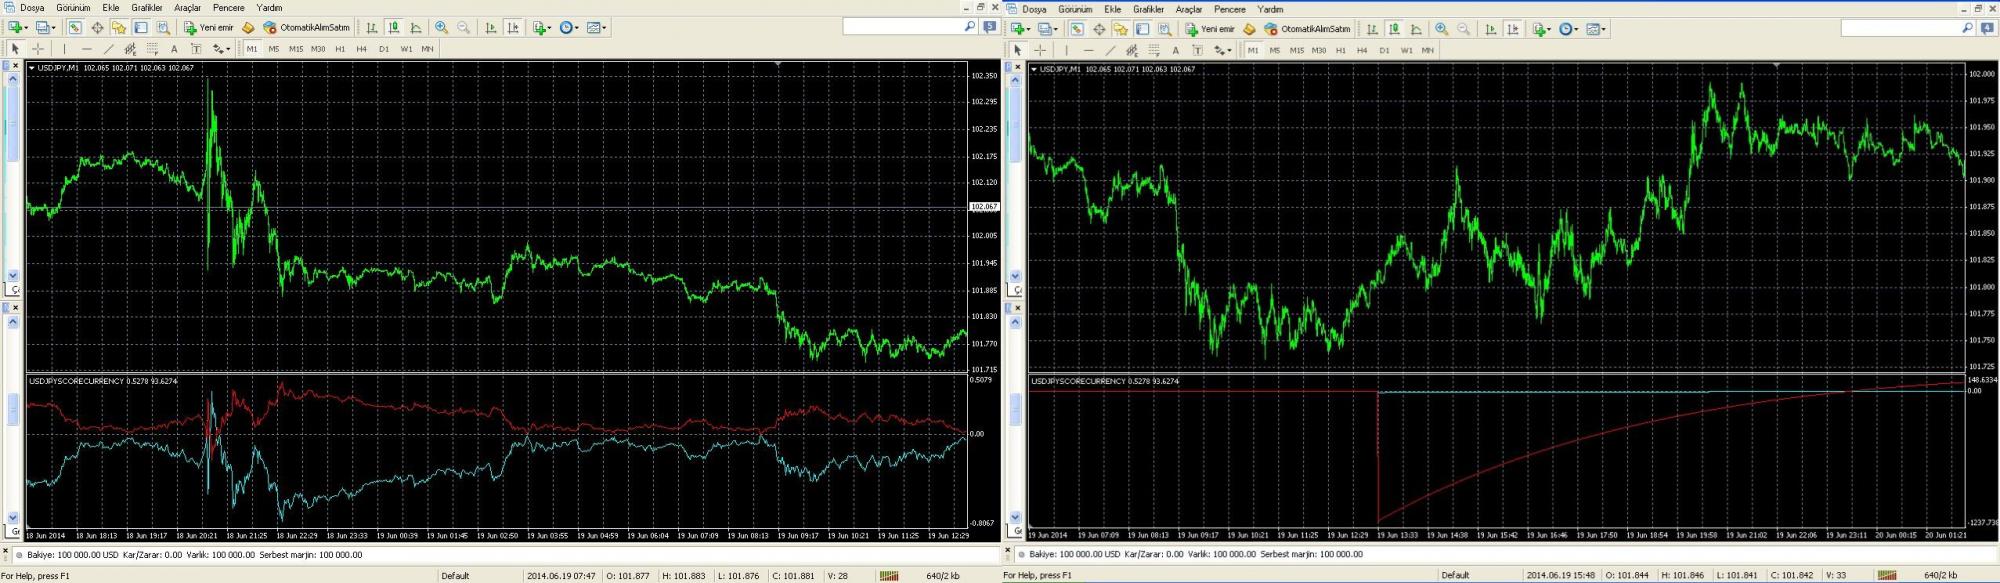
The problem is initial value
Limit the number of displayed values (with SetIndexDrawBegin()) or change the calculation way
Thanks for very quick reply.
I attached the indicator.
Please try it in your metatrader.You have an average of an average. Using metatrader built in iMAOnArray() functions you will always have that kind of results on the oldest bars. Simply disregard those if you do not want to write your own average functions
I cannot disregard, because that fault effects the results along the line. I use MaAvg=600.
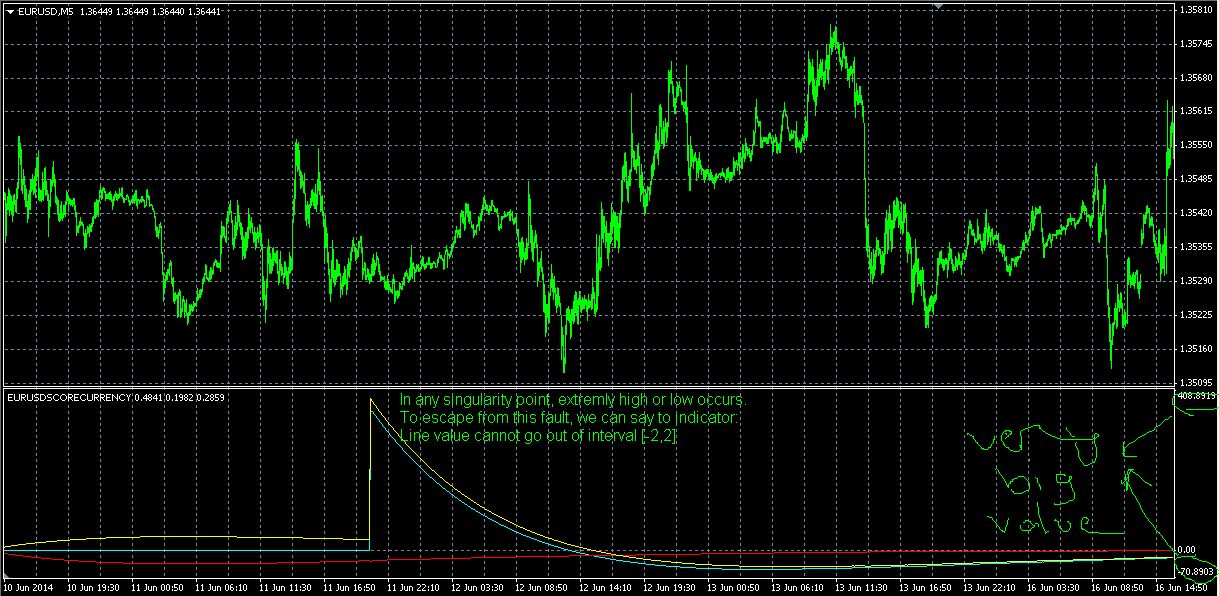
I think i found the fault. There is a very big peak with same direction in the date "2014.06.09 15:30".
Maybe i can code it in the way that: (Max,Min) values of lines are not bigger than "+0.1" and lower than "-0.1".
I cannot disregard, because that fault effects the results along the line. I use MaAvg=600.
I think i found the fault. There is a very big peak with same direction in the date "2014.06.09 15:30".
Maybe i can code it in the way that: (Max,Min) values of lines are not bigger than "+0.1" and lower than "-0.1".Sorry, but nothing to do with a peak (you can check it easily - change the symbol or time frame or broker and see what is going to happen with values on those same bars)
All to do with the way how internally metatrader calculates moving averages (and moving averages on arrays).
Is it custom indicator or public one? Seems I use the same indicator but never had this error in my platform. I use it in HF MT4, maybe it matters ?
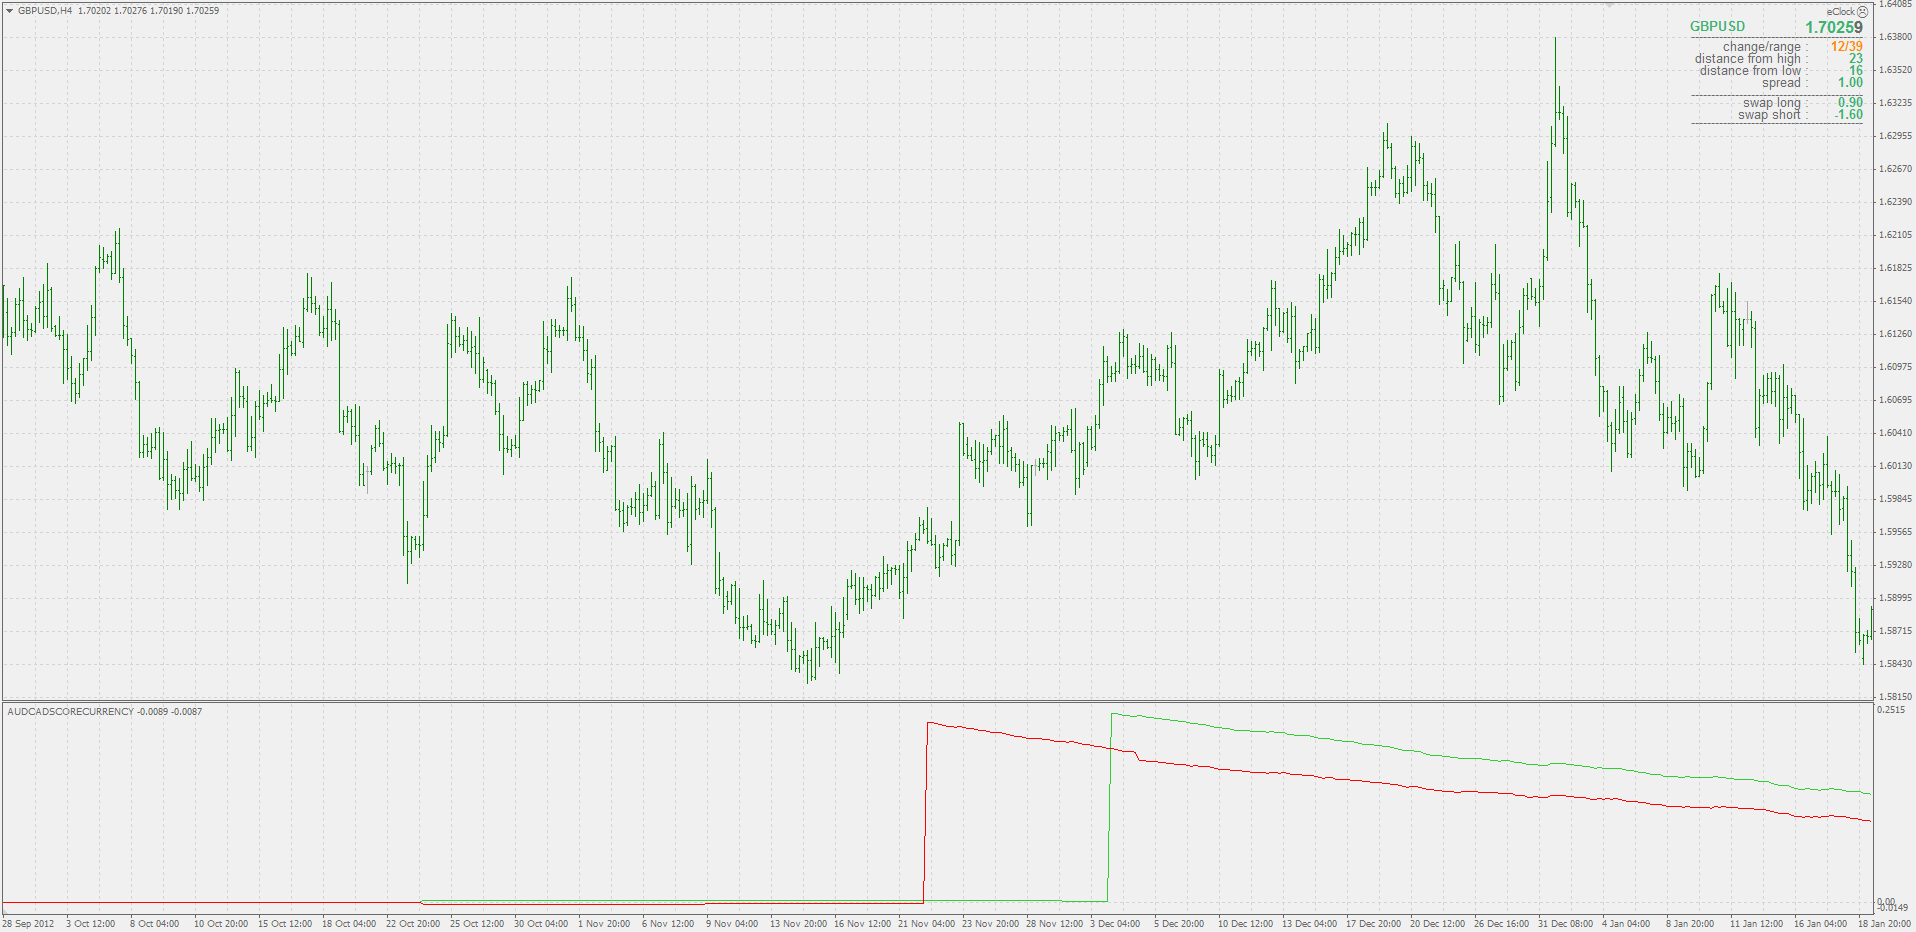
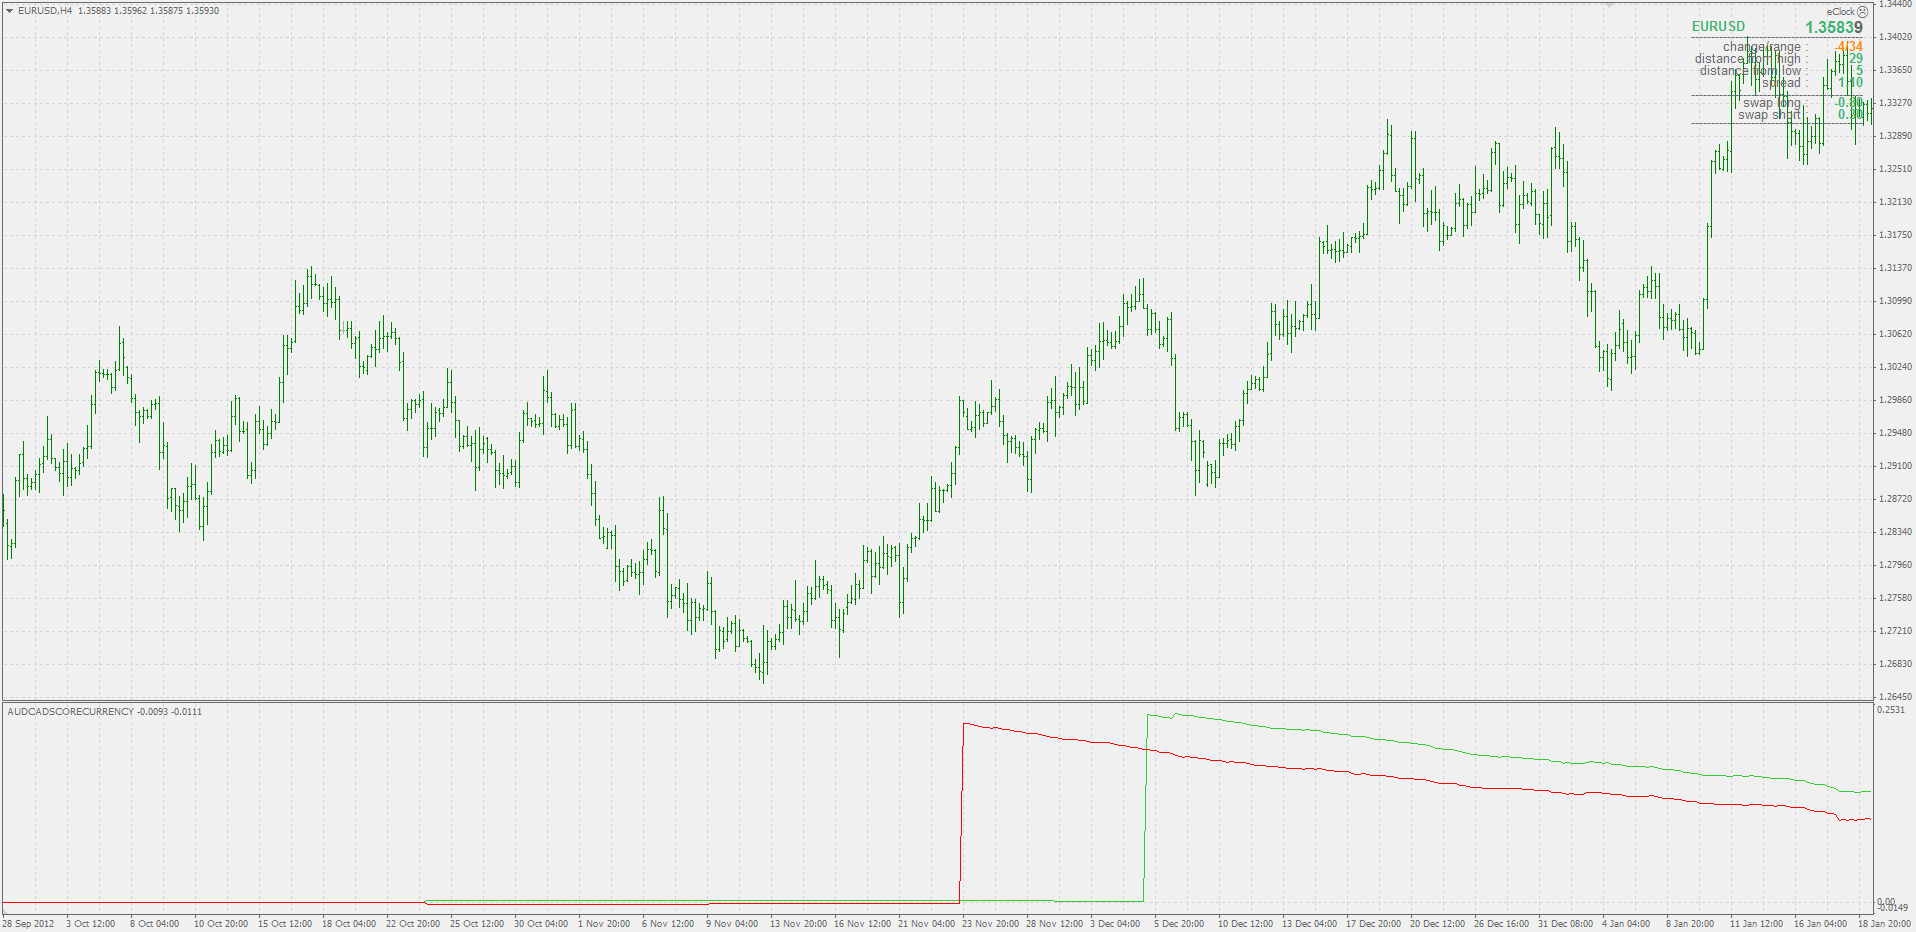
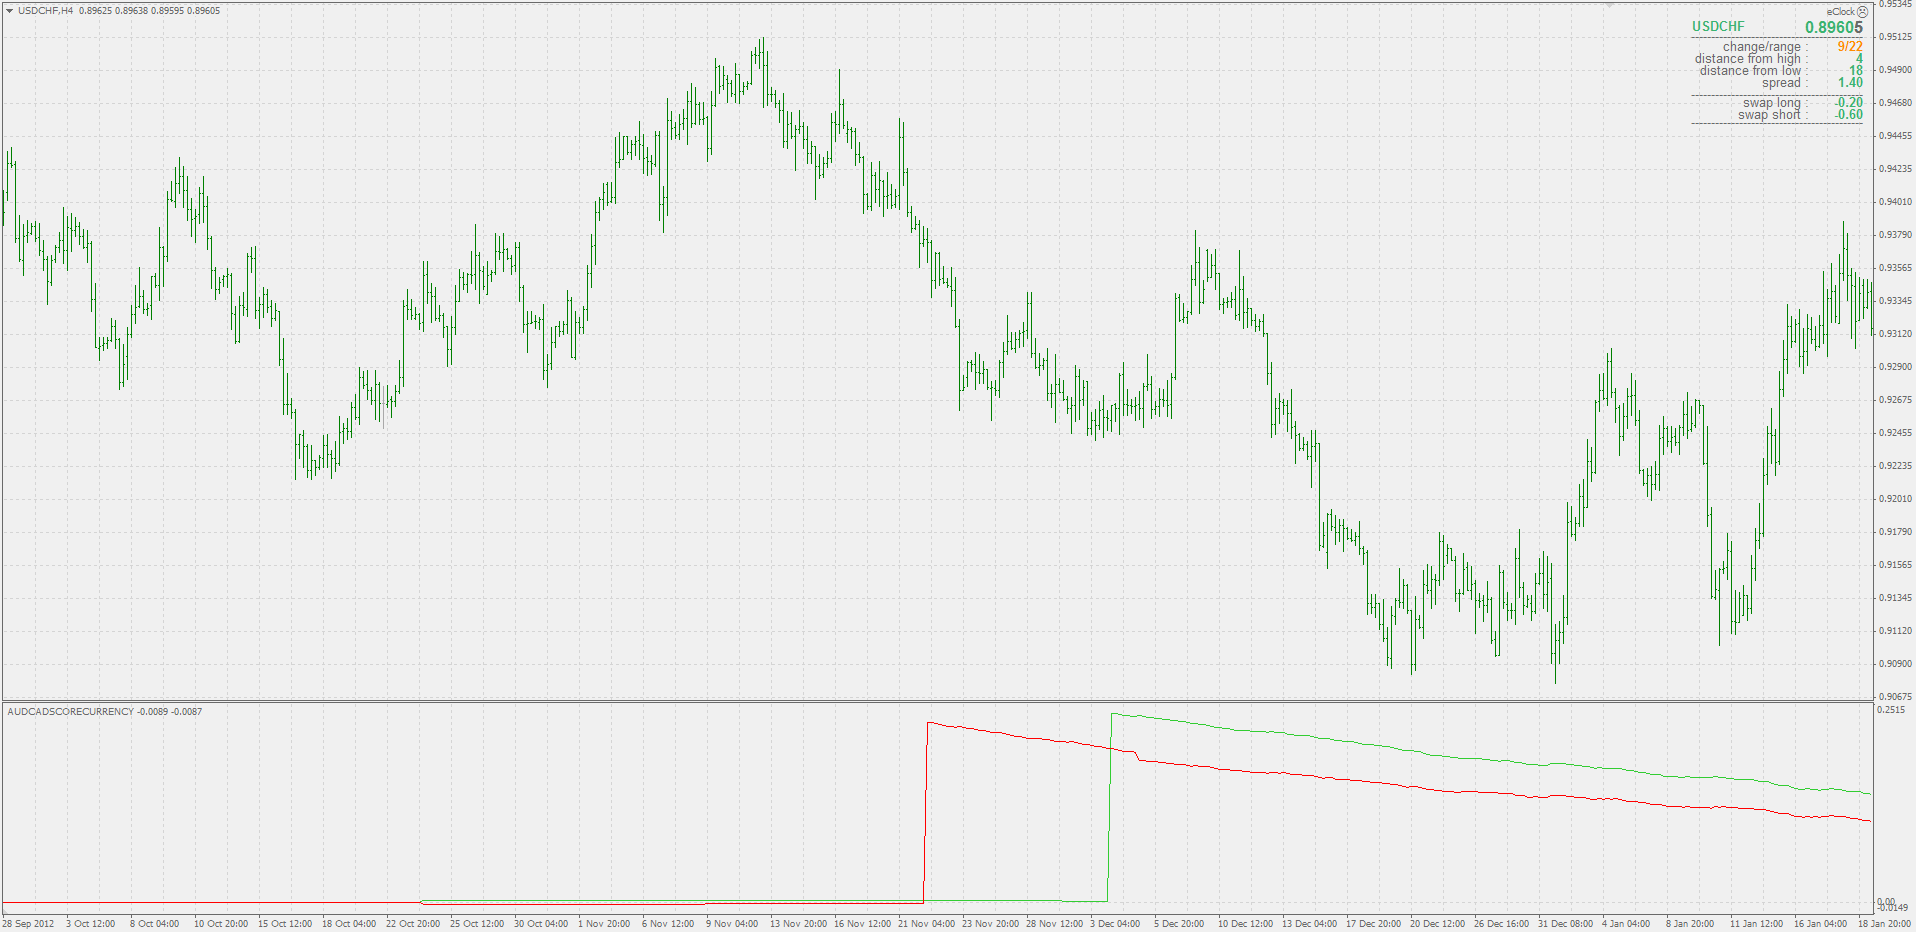
Go to past bars, close to the oldest bars on chart - every time frame and every symbol is going to have that (like on these examples - no exception) :
i coded the indicator. I have been using this indicator for 3 months. I hadn't encountered such a case before.
----------------------
Some currency pairs let me to use MaAvg=600 in M15 time frame. I use the indicator generally M5 time frame and MaAvg=600.
I hope it will let me to use MaAvg=600 in the next days, when it is getting far from the singularity point.
----------------------
I have a question either!
I can use the AUDCADscorecurrency indicator just in chart AUDCAD.
When i want to open; lets say; chart EURNZD, i must attach theEURNZDscorecurrency indicator.
Namely, i have 28 indicators to attach them to chart one by one manually.
I would like to build just one indicator, when i attach it to related chart, the indicator will pull the symbol of the chart.
How can i do it? To built EURNZD; how can i pull the first name of symbol "EUR" and the second name of symbol "NZD" seperately.
Is there any coder to code my idea?
Since i am not a coder, code of my indicator is limited with those i learned from internet and tutorials. Namely, i coded this indicator by the knowledge of 1-week. I cannot code in advanced degree.
An e-mail had come from forex-tsd. It asks me for: If you have any idea or trade strategy, share with us.
My idea is this indicator. I know there are some indicator doing almost same job. But i cannot read all codes of those, that is why i don't trust those indicators. And my indicator gives clues about trade oppurtinity by looking at divergence.
My wishes:
1. The indicator all in one!
In my former message, i had explained:
"I can use the AUDCADscorecurrency indicator just in chart AUDCAD.
When i want to open; lets say; chart EURNZD, i must attach the EURNZDscorecurrency indicator.
Namely, i have 28 indicators to attach them to chart one by one manually.
I would like to build just one indicator, when i attach it to related chart, the indicator will pull the symbol of the chart.
How can i do it? To built EURNZD; how can i pull the first name of symbol "EUR" and the second name of symbol "NZD" seperately.
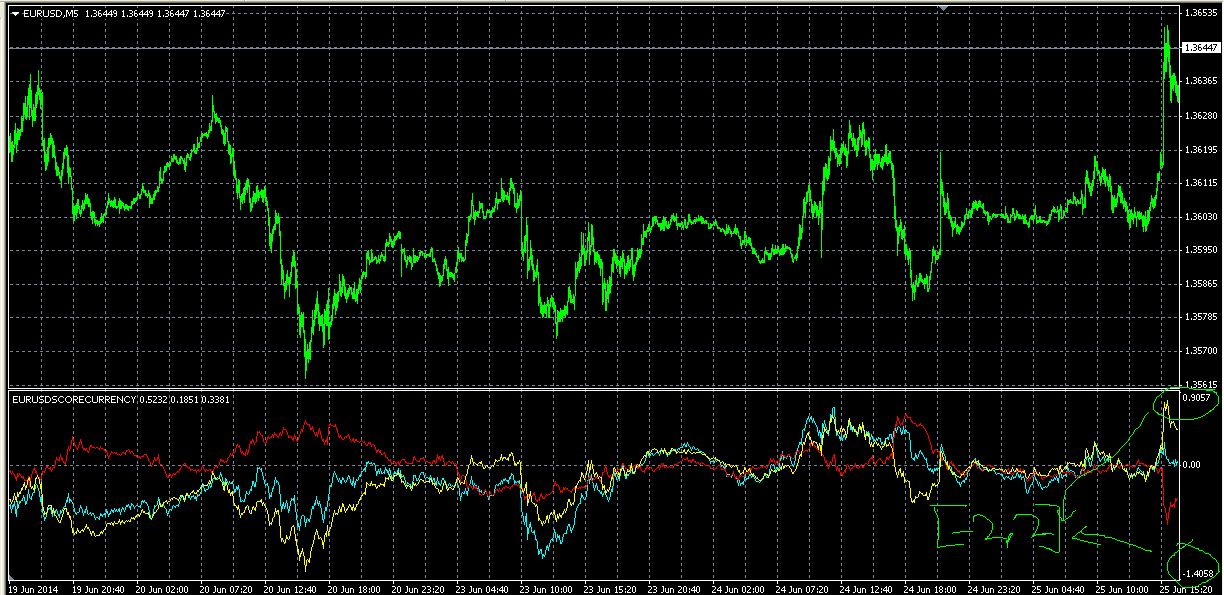
2. To prevent aberration of indicator line; max value of line can be restricted within (-2 , +2). Namely, if the value of line is bigger than 2, write it as 2; if the value of line is lower than -2, write it as -2. That's it. But i cannot succeed in coding.
Knowledge increases by means of sharing
Is there any coder to code my idea?
Since i am not a coder, code of my indicator is limited with those i learned from internet and tutorials. Namely, i coded this indicator by the knowledge of 1-week. I cannot code in advanced degree.
An e-mail had come from forex-tsd. It asks me for: If you have any idea or trade strategy, share with us.
My idea is this indicator. I know there are some indicator doing almost same job. But i cannot read all codes of those, that is why i don't trust those indicators. And my indicator gives clues about trade oppurtinity by looking at divergence.
My wishes:
1. The indicator all in one!
In my former message, i had explained:
"I can use the AUDCADscorecurrency indicator just in chart AUDCAD.
When i want to open; lets say; chart EURNZD, i must attach the EURNZDscorecurrency indicator.
Namely, i have 28 indicators to attach them to chart one by one manually.
I would like to build just one indicator, when i attach it to related chart, the indicator will pull the symbol of the chart.
How can i do it? To built EURNZD; how can i pull the first name of symbol "EUR" and the second name of symbol "NZD" seperately.
2. To prevent aberration of indicator line; max value of line can be restricted within (-2 , +2). Namely, if the value of line is bigger than 2, write it as 2; if the value of line is lower than -2, write it as -2. That's it. But i cannot succeed in coding.
Knowledge increases by means of sharingNot sure that I understood, but check this thread : https://www.mql5.com/en/forum/178052
No no, i don't mean that, Mladen!
------------------------
For the first wish: I have 28 indicators for each pair(EURUSDSCORECURRENCY, AUDUSDSCORECURRENCY, EURNZDSCORECURRENCY, GBPCHFSCORECURRENCY, ...). I want to have just 1 indicator. When the indicator is attached to whichever chart, indicator will identify the pair.
I cannot code it exactly, but i can come close to coding it. Namely, when i open chart EURUSD; Symbol() will be EURUSD; StringSubstr(Symbol(),0,3) andStringSubstr(Symbol(),3,3)give "EUR" and "USD", respectively. Namely, indicator will identify the chart automatically. Take a look at code of the indicatorEURUSDSCORECURRENCY.--------------------------------------------------
For the second wish: To prevent the singularity point fault, we must restrict the values of lines in a definite interval. Namely, indicator line value must not go out of interval [-2,2]. Even if, in singularity point, the value wants to jump to 400; it will not jump to 400, its value will be max 2.
I cannot code it exactly either. I want to code: if(LineBufferEUR>2) --->LineBufferEUR=2
Namely, LineBufferEUR cannot exceed value "2".
-------------------------------------------------
This indicator gives very good entry point to trade. But it must be cleaned against singularity points.
- Free trading apps
- Over 8,000 signals for copying
- Economic news for exploring financial markets
You agree to website policy and terms of use
When i scroll the roller to see back of chart, indicator attached aberrates.
1. What is the source of problem?
2. How can it solve?