FXOpini | Technical | Fundamental
Potential Continued Rebound In USD / CHF
In general bias intraday movement of USD / CHF at 4-hourly charts are in a state stuck in the support area and current potential price reversal pattern forming ascending triangle where there is a possibility the price will move up. If the dollar strengthened against the franc to penetrate resistance at .9530 opportunites price will move up towards resistance at 0.9646.
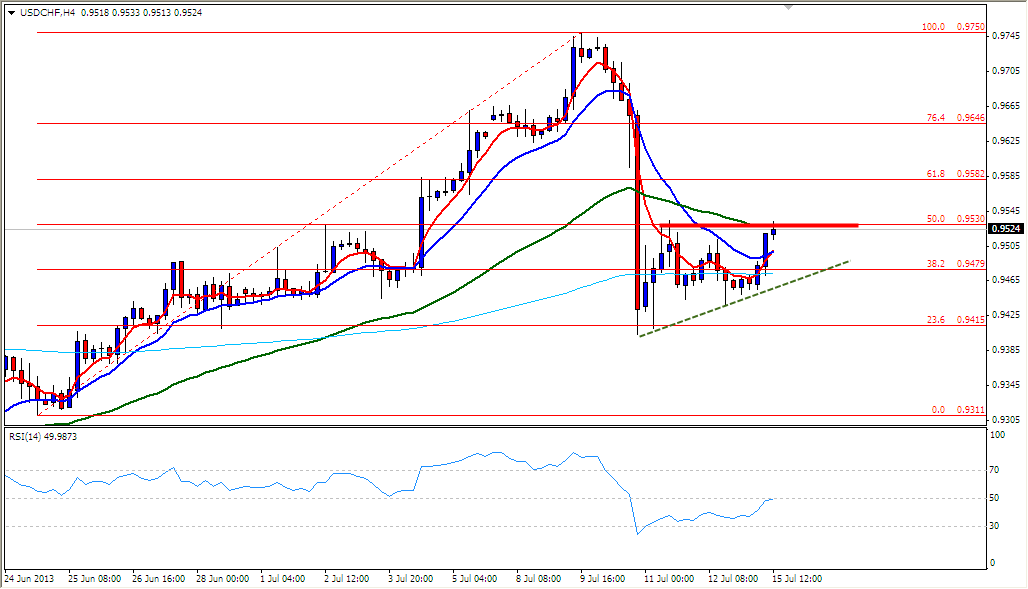
Conversely, if the price moves down to penetrate the lower line of the formation of a potential opening price will fall more deeply with the move towards support at 0.9415 - 0.9311.
Beware Continued Rebound In Gold
In general, the movement of gold in the 4-hourly chart is in bullish mood and the current price could potentially form a symmetrical triangle price pattern where there is a possibility the price will move up. If gold rose against the dollar to penetrate the upper line of the price pattern and resistance 1298.83 opportunites price will move up towards resistance at 1331.11.
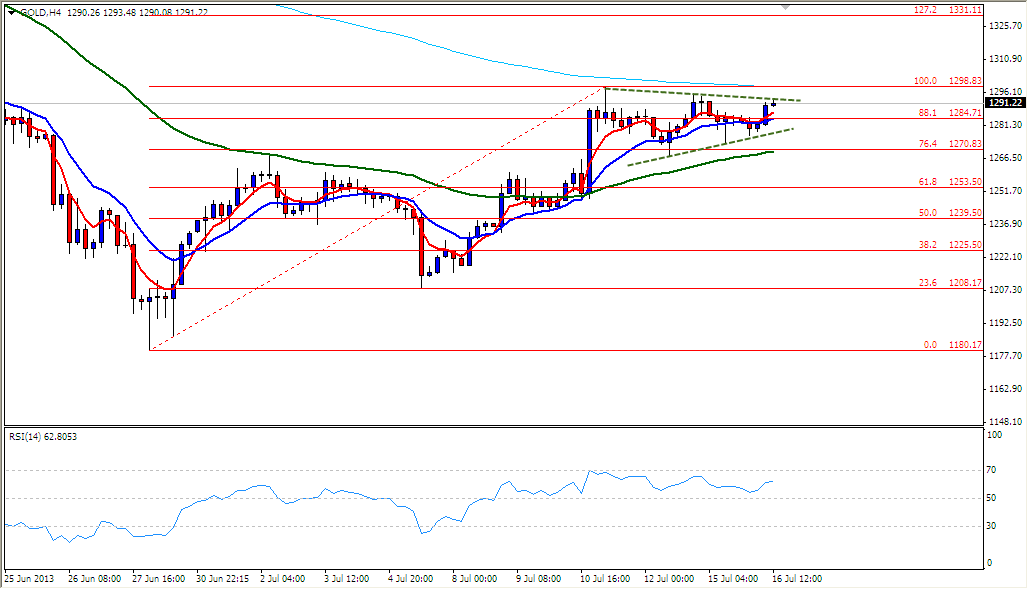
Conversely, if the price moves down to penetrate the lower line of the price pattern and unlock the potential price of 1270.83 support will move down towards the next support at 1253.50-1239.50 range.
GBP / USD Bearish, Note pattern Price Inverse Head Shoulder
In general, the movement of GBP / USD at 4-hourly chart is in bearish conditions but currently has the potential price of the price pattern forming inverse head and shoulder where there is a possibility the price will move up. If the pound rose against the dollar with penetrating neck line opportunites price will move up towards resistance at 1.5392 to 1.5638.
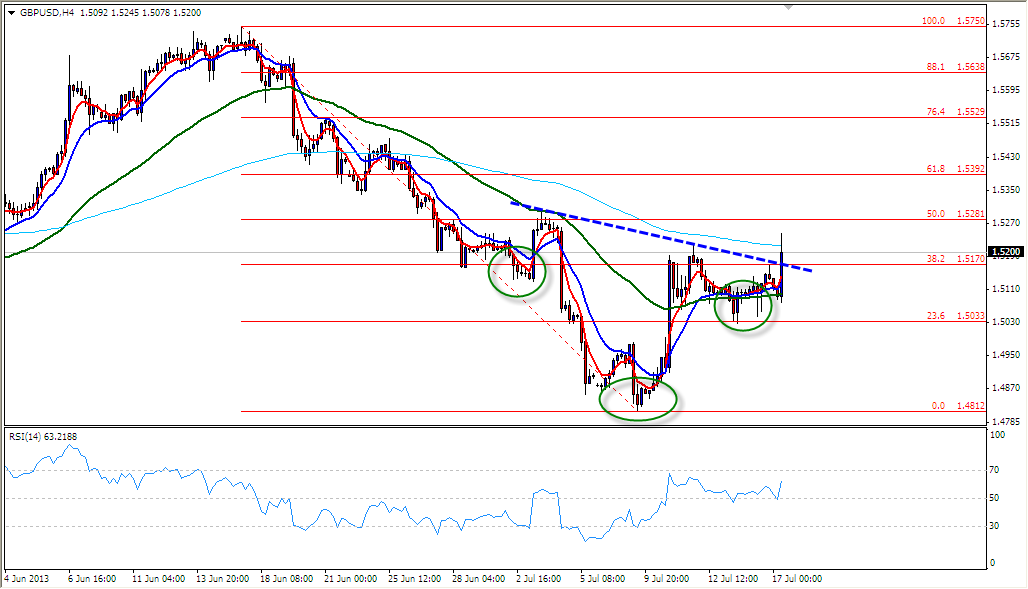
Conversely, if the price does not get into and stuck firmly below the neck linemembuka potential price pressure will again be in a bearish price pattern formed and will potentially fail with a momentum indicator RSI moves downward through the level of 50
GBP / IDR In Phase Rebound
In general, the movement of GBP / USD at 8-hourly charts are in a state of rebound and prices move in the pattern of bullish price channel. Note also, if prices remained strong in the lower line pattern bullish price channel opportunites price will move up towards resistance at 15360.34.
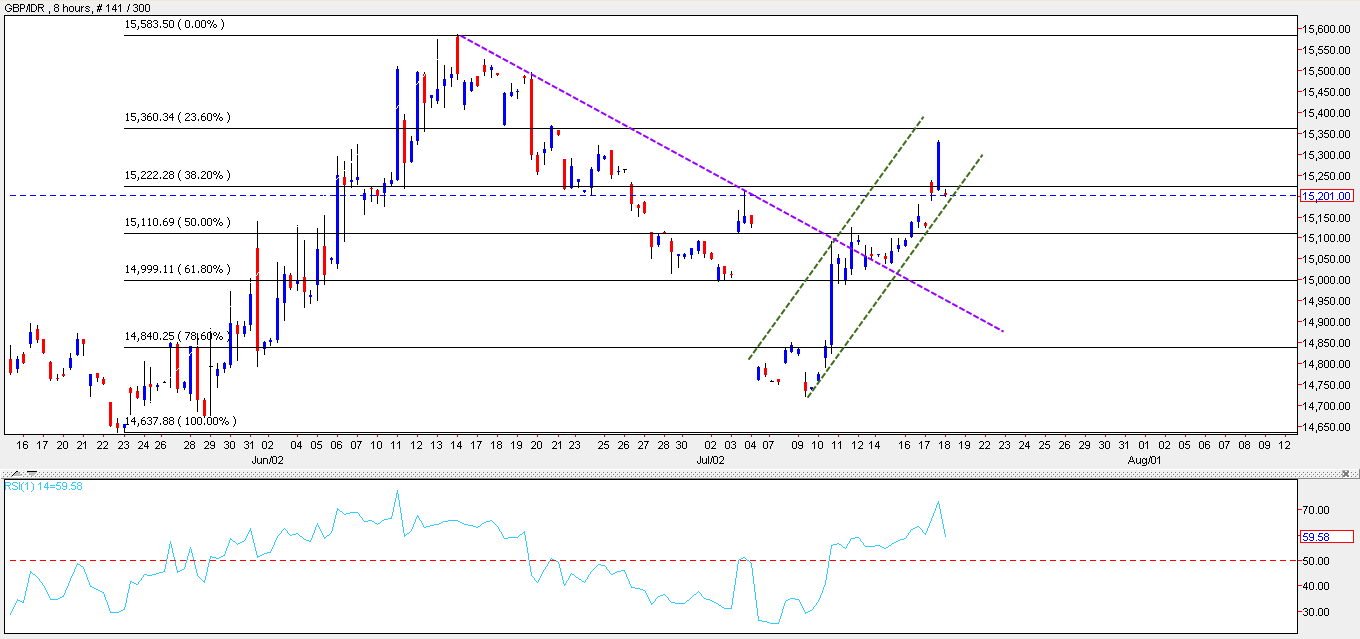
Conversely, if the pound weakens against the dollars to penetrate the lower line opens up the potential price will move down towards support 15110.69 - 14999.11 with bearish momentum they would when the RSI indicator moves and penetrate below the 50 level
GBP / IDR In Phase Rebound
In general, the movement of GBP / IDR at 8-hourly charts are in a state of rebound and prices move in the pattern of bullish price channel. Note also, if prices remained strong in the lower line pattern bullish price channel opportunites price will move up towards resistance at 15360.34.
Conversely, if the pound weakens against the dollars to penetrate the lower line opens up the potential price will move down towards support 15110.69 - 14999.11 with bearish momentum they would when the RSI indicator moves below the 50 level menemebus
Yen Strengthens Against Rupiah
Movement of the JPY / IDRat 8-hourly charts are in a bullish condition where there is still a chance the price will move up to test resistance at 103.11 which is the 23.6% Fibonacci retracement area.
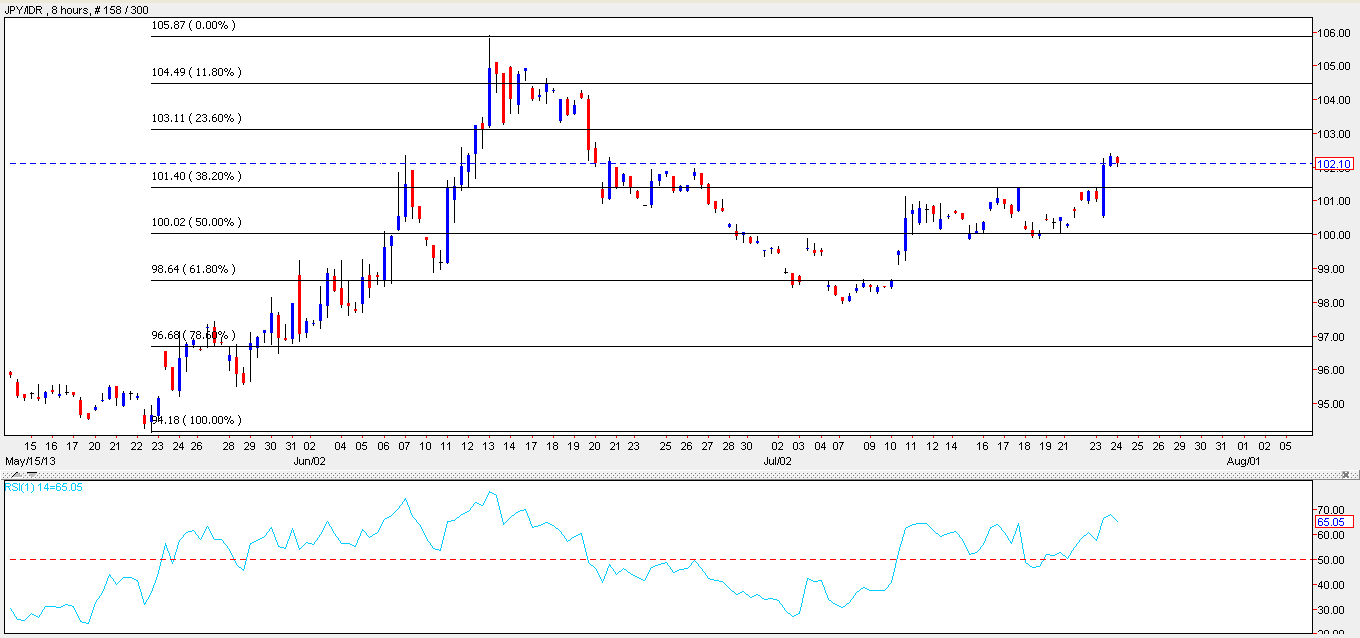
Technically potentially RSI indicator is in bearish condition, if the indicator moves down through the level 60 will unlock the potential of the yen fell slightly against the rupiah which support 101.40 would be an area of potential on the go if it moves down
GBP / JPY Still Bullish, Phase Correction Notice
In general, the movement of GBP / JPY at 4-hourly charts are in bullish mood and the current price looks stuck in the support area where it is likely the price will move up. If the resistance at 153.19 penetrated opportunites price will move up towards the next resistance at 154.02 range.

Instead beware because technically the RSI indicator is in bearish divergence condition. If support 152.38 penetrated by unlocking the potential price of sterling will weaken against the yen where there is potential support at 151.37 will be tested by the price.
Gold Still In Bullish Bias
In general, the movement of gold in the 4-hourly charts are in a bullish condition. If gold rose against the dollar and penetrate resistance at 347.62 would open up more opportunities in gold prices move up towards resistance at 1385.69.
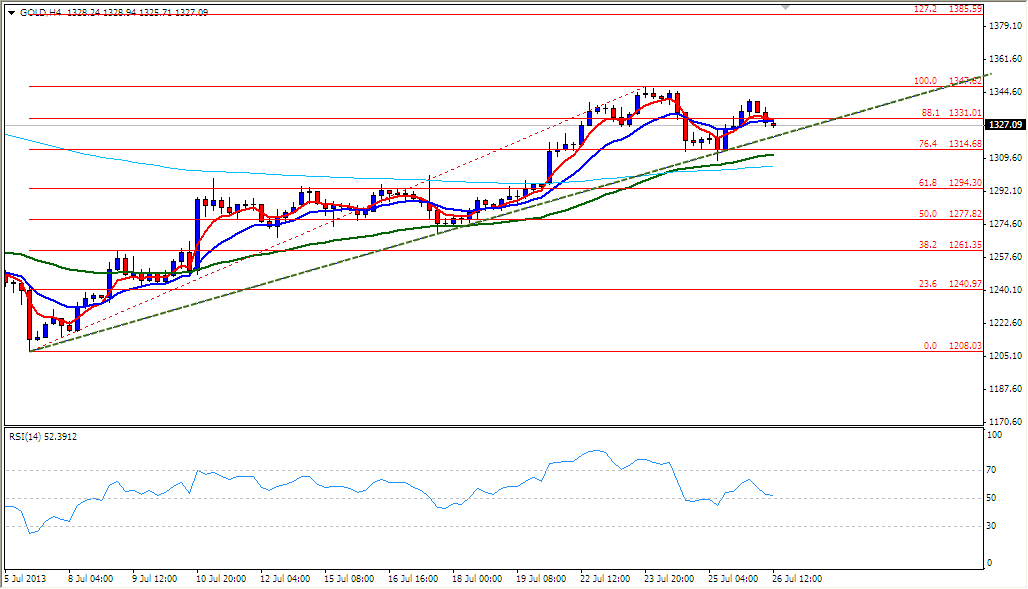
Conversely, be-alert if gold fell against the dollar to penetrate the trend line that serves as a support and support 1314.68 penetrate that there is potential of the gold price will go back down towards the correction to next support at 1294.30 range. Technically potentially RSI indicator is in bearish condition.
XAU/USD Bullish Rebound
In general, the movement of gold in the 4-hourly charts are in a bullish condition and current price rebound could potentially form a symmetrical triangle price pattern where there is a possibility the price will move up. If gold rose against the dollar to penetrate the upper line of the price pattern and resistance 1347.62 opportunites price will move towards resistance at 1393.17.
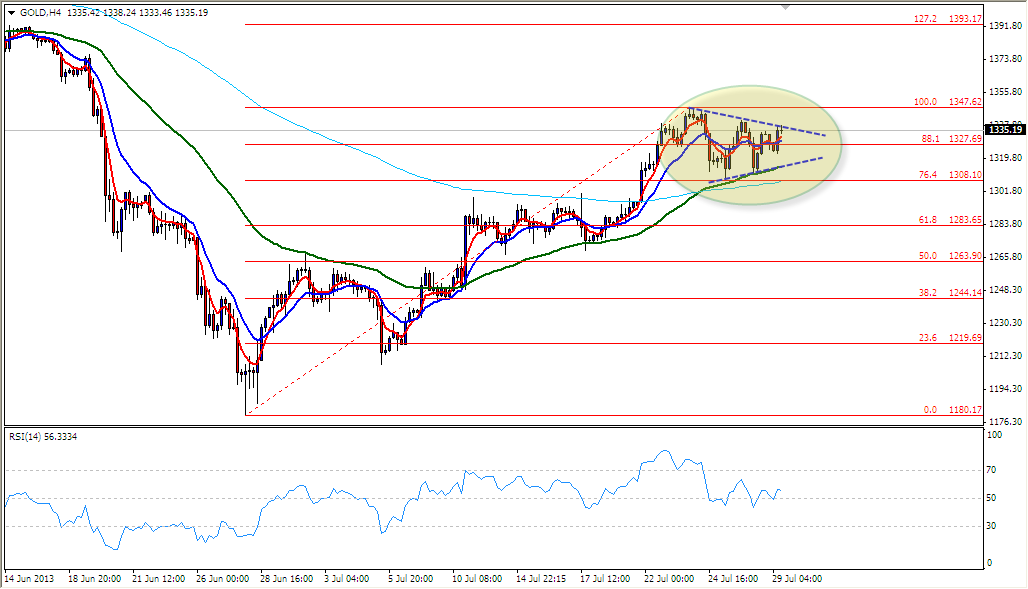
Conversely, if gold fell against the dollar by penetrating the lower line of the price pattern and unlock the potential price of 1308.10 support will move down towards support at 1283.65. Will be seen as bearish momentum indicator RSI moves downward through the level of 50.
Bearish Pressure On EUR/CHF
The movement of the EUR / CHF is in a bearish condition. If the price moves down to penetrate support at 1.2311 would open up the potential for a sharp fall in prices will further support at 1.2275 where there is a possibility that a $ 23.6 Fibonacci retracement area will be in touch by price.
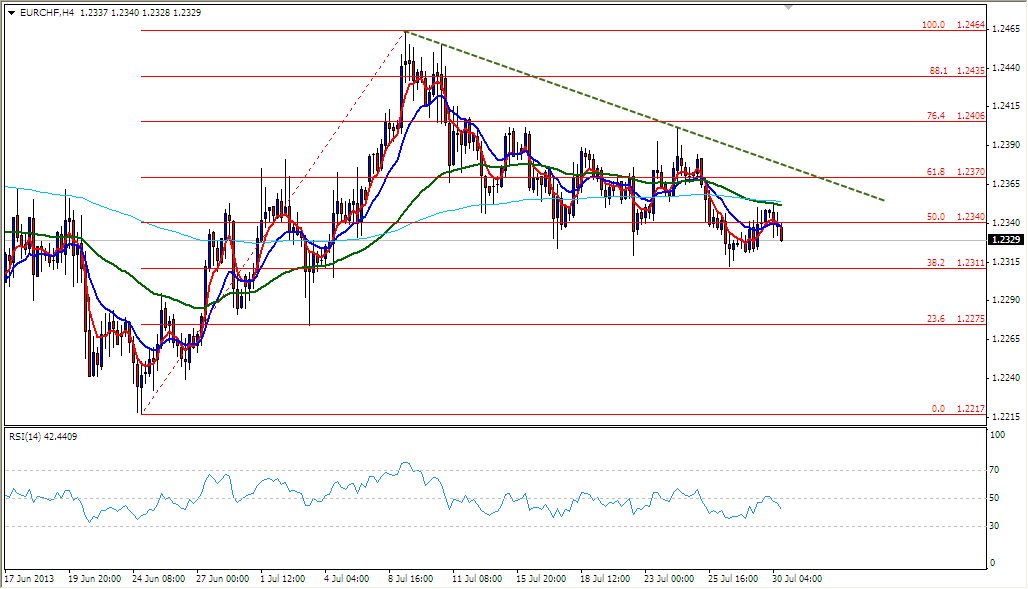
Conversely, if the euro strengthened against the franc to move up to the rebound phase then have the opportunity to trend line resistance at 1.2370 which serves as a resistance to the movement of prices will be in touch. Be seen as bullish momentum indicator RSI moving up through the level of 50.
- Free trading apps
- Over 8,000 signals for copying
- Economic news for exploring financial markets
You agree to website policy and terms of use
EUR / CHF Potential Will be Corrected
In general, the movement of EUR / CHF at 4-hourly charts are in a bullish condition. If the euro strengthened against the franc to penetrate resistance at 1.2406 opportunites price will move up towards resistance at 1.2464.
Conversely, if prices move below support at 1.2370 opens up the potential to penetrate the price will move towards the 1.2340 support area which is 50% of Fibonacci retracement. Technically potentially RSI indicator is in bearish conditions