ForexPeoples Daily Technical Analysis for The Majors (4 Pair Forex)
Daily Technical Analysis for Wednesday, August 01, 2012 EURUSD Till now, I see - the EURUSD on still bulls trend - the TCCI 20 day still show this bulls, of course. On the big trend, we can see that the strong bulls on this pair can play nice here if the price from bottom was truly can break up more to that pivot line at 1.2394. So, for this time = search for next nice Buy OP = better. I see. GBPUSD The GBPUSD look pullback down from that supply area (1.5717). Just be careful for probably price more down if that 23.6 fibo line (1.5657) can be break by price from top (on today price movement). On my see if that 23.6 fib can be break by price from top = Search for Sell here = better. USDJPY Daily TF trend on this USDJPY pair = still look on bearish = it can be see from the TCCI 20day = still show that red line, of course. Then, this bearish look was more weak as long as the price still can not break down to that weekly breakout line (77.94). So, yes, with this look = wait and see can become more great idea. Then, Sell on this pair can be nice if truly the price from top can breakdown too to that strong weekly breakout line = break from top. USDCHF On daily TF = I see the TCCI trend till now still bearish, but almost weak = as long as the price can not break down to that more pivot line at 0.9697. For now = yes, the probably price still on sideways first and we can sell again on this USDCHF pair after truly the price from top can break down to that pivot 0.9697, I see.  Regards.
Friday, August 03, 2012 EURUSD I see - the more bearish probability still look here. The candle till now still play bellow that TCCI (daily TF), And so, because of this - I see the more price to become more bearish can be here if then price on today move can break down more the daily breakout line (1.2133). So, search for next nice Sell OP here better if truly price can break down to that daily breakout line (1.2133). I see. GBPUSD The GBPUSD on still can probably more bearish for today move if then price can break down to that 61.8 fib line (1.5462) = break from top. So, on my simple look = search for next nice Sell OP here is better idea if truly price from top can break down more that 61.8 fib = break from top, of course. USDJPY Here was formed a double bottom - the price look pullback from that weekly breakout line (77.94). And because of this = Yes, the more probably bulls here as long as the price can not break down again to that weekly breakout line (77.94). And I see = for now = search for next nice Buy OP here = nice idea. USDCHF The USDCHF on look more bulls - the price till now can be open on above that TCCI line and I see the daily candle on yesterday likely a nice bulls pinbar = So, here is a nice formation that probably price to bulls and search and make Buy OP here then = better, I see.
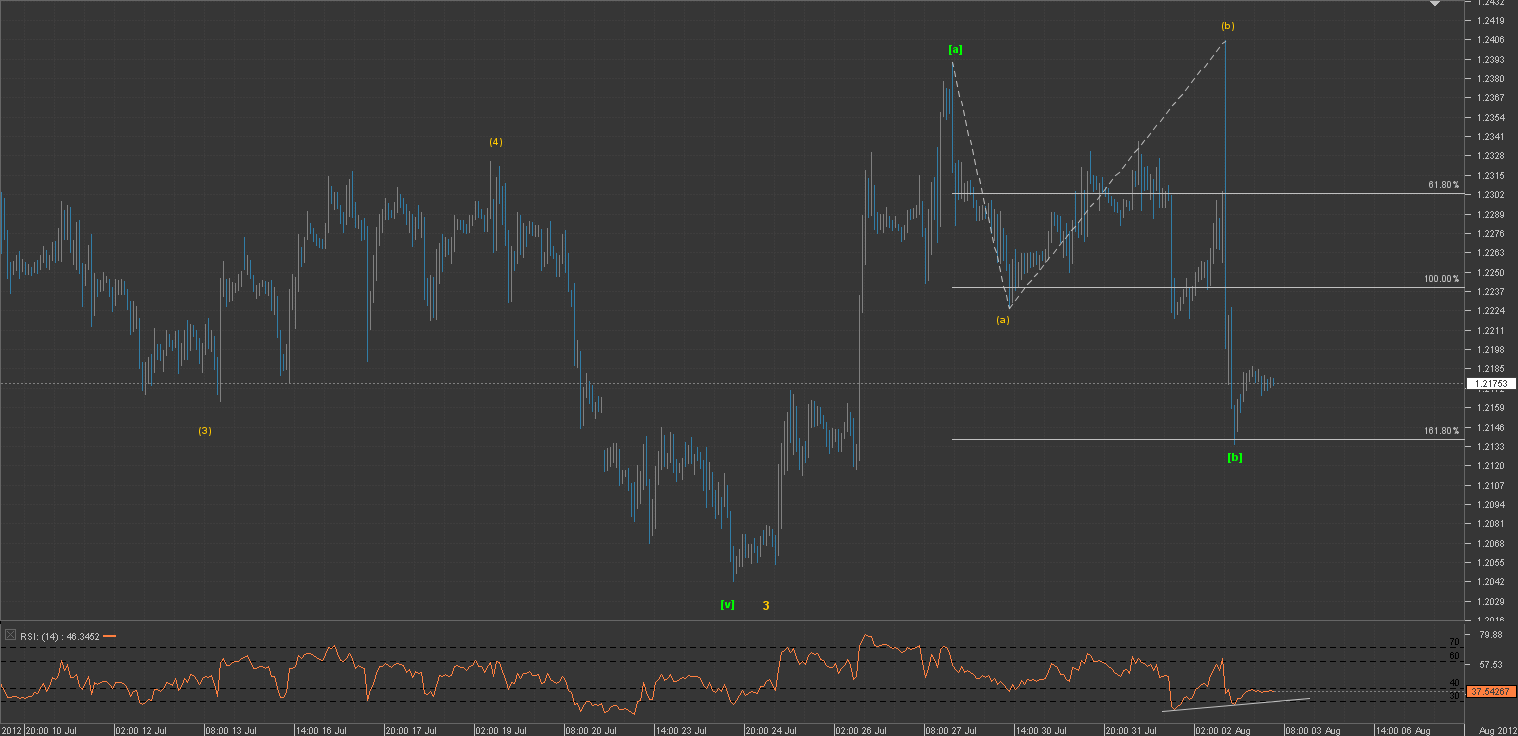
EUR/USD - Elliott Wave Analysis Daily Update
EUR/USD- We have seen clear 3 waves (a)-(b)-(c) on the wave. Wave (c) end at 161.8% expansion of wave (a) and (b). I am looking for [c] from that point.
Sunday, August 05, 2012 (for next opening price - tomorrow)
EURUSD
On last Friday, We can see that price on EURUSD look bulls trend and almost break that pivot line (1.2394). But look still failed to break that pivot 50% fibo. Then, I see the trend on daily TF still nice bulls, this can be see from the TCCI line that till now still on bulls. So, on my see if then price can break up more that pivot = break from bottom, search fro nice Buy OP here = better, of course.
GBPUSD
On last Friday, we see the price on GU = bulls with nice strong bulls move. Then, I see - this pair can become more bulls again for next price move = if then price can break up more to that 23.6 fibo line at 1.5657. Then, if on next price move = the price from bottom can break up more to that 23.6 fibo (1.5657) = I see - this can become a more nice bulls probably here and search for Buy = nice decision, then.
USDJPY
The USDJPY on look pullback up from that strong support line or Weekly breakout line at (77.94). With this look = Yes, search for nice Buy OP here = better. The more probably price to pullback bulls = Yes, here. And I see - this bulls can be more strong move here if truly price from bottom can break up more to that Golden Ration Fibo (61.8 fib line) at price 78.78. Note : We can see that TCCI 20day averages (on daily TF) still nice to support for this bulls till now.
USDCHF
Bearish continuation can be here = if the price can break that strong picot line at (0.9697). So, if that pivot was break by price from top = Yes, the Next nice idea for trade on this pair is = just search for nice Sell OP (using smaller time frame = better). I see.
Regards.
Monday, August 06, 2012 EURUSD The bulls still look here = after we see the price now can be open on above that pivot line (1.2394) on Daily TF. Then, with this simple candle look = of course, I can predict that probably price to test more up to max. near that golden fibo ratio = here (61.8 fib = 1.2477). So, yes, search for nice Buy OP here using smaller TF = better, I see. GBPUSD I see the more probably bulls still look here for today move = if then price (from bottom) can break up again more to that 23.6 fib line (1.5657). So, with this look, of course search for nice Buy OP on this GBPUSD = good idea for today trade (with Stoploss max. bellow that 38.2 fib (1.5582), I see. USDJPY The USDJPY price till now on still sideways first = but then, I see this pair can be more nice Strong bulls trend after truly = the price from bottom can break up more to the Golden Ration Fibo (61.8 = 78.78). Once again = I can say with clear that, If that 78.78 can be break by price from bottom - I see this will be a nice trigger to become more bulls here - and if that happen = search for nice Buy OP here = better idea, of course. USDCHF I see = after the price can be open bellow that Pivot line (0.9697) = this pair look to become more probably bearish. And if we see this price condition with Fibo = this quite clear that price probably want try that golden fibo ration (61.8 fib line at price 0.9632). So, on this bearish trend (that also supported by the nice Red TCCI on daily TF) = I see = search for next nice Sell Op (on more smaller time frame) = better idea here. Regards.
Tuesday, August 07, 2012 EURUSD The trend till now on still bulls = Can be see from the TCCI on daily TF (TCCi with using 20 day average). And yes, I see this will probably more bulls again if that daily breakout line at price 1.2442 can be break too by price from bottom = if that happen = Search for Buy OP = better, then, I see. GBPUSD The GBPUSD on look to bearish - but weak and look just a little volatile price movement. On daily TF, we can see that price can be open bellow that TCCI 20 day (on daily TF). with this look = I see the more probably price to more bearish = here. Look to the TCCI line on daily that still on support this bearish, I see. USDJPY The price on USDJPY till now still look consolidation but more probably to Go Up (the TCCI line on daily TF show this trend bulls = but still weak). I mean, we can take a buy OP here after the price from bottom = truly can break up more to the strong 76.4 fib line at price 78.35, if that 76.4 fib can be break by price from bottom = Yes, search for Buy Op = better here - with using max, Stoploss bellow the price 77.90 (strong weekly breakout line), of course. USDCHF Yes = The big trend (daily TF) still look bearish but weak = I say weak it's because the price still difficult to break more down to the strong daily breakout line at price 0.9656. So, with this look = I see the more probably sideways first look here = just wait and see and pay attention to the price move. if then price from top can break down too to the strong daily breakout line (0.9656) = Yes, search for Sell = better idea here, I see. Regards.
Wednesday, August 08, 2012
EURUSD
EURUSD Price till now still look on consolidation near that pivot line (1.2394). So, I see - the wait and see action can still better idea here. But, then, after I see the still strong and nice TCCI Bulls = Yes, this pair can more bulls IF then price from bottom can break up more to the strong daily breakout line at 1.2442.
GBPUSD
GBPUSD price on still sideways with quite high volatile movement, I see. Just wait and see with this condition. Till now price look move near that TCCI line on daily TF. And I see the TCCI still give a bearish condition. So, with this look, I see this GBPUSD can be more bearish if the 38.2 fibo line (1.5582) can be break by price from top.
USDJPY
More bulls still look here = after we see the price can not break down more to the strong weekly breakout line at price 77.90. Then, I see - The TCCI line on daily TF now on look bulls of course. but to become more bulls = of course - this USDJPY pair must break up to the strong 61.8 fibo (Golden Ratio = 78.78). So, of course - if that 78.78 can be break by strong bullish candle from bottom = search for nice Buy OP here = better.
USDCHF
Big trend (daily TF) still look bearish = it can be see with nice TTCI on daily that now still show bearish. Then, of course I can say this pair on more and can be take start search for sell OP again after truly the price can break down to the 61.8 fib line (0.9632). So, as long as the price still move above that 61.8 fib = I call this still sideways = just wait and see = it's better, I see.
Regards.
Daily Technical Analysis for Thursday, August 09, 2012 - by ForexPeoples.Com
EURUSD
Till now, I still see that this EURUSD pair on look still bulls, can be see with TCCI 96 now on bulls and also we see the TCCI 16 = bulls too. The price now want to try that supply area at near 1.2380. So, please be careful about price sideways first after truly near that supply. but Bulls trend still show this pair.
GBPUSD
The GBPUSD also on nice still bulls. But for now price look consolidation first near that 1.5677. On my see = for today probably move = this GU will probably continue UP if truly then price can break that 1.5677 from bottom with strong bulls candle then. Look that TCCI 96 on 15M TF = still support for this bulls.
USDJPY
On my see = this pair (USDJPY) for today move = can become more nice bulls if truly price from bottom can break up that 23.6 fibo line (78.48). if that (78.48) can be break from bottom = Yes, make a buy Op here with TP before price touch that strong resistance (78.52) = better. The Nice TCCI 96 still nice support for this bulls opportunity. I see.
USDCHF
The USDCHF on still nice bearish. Adn for today move = I see this bearish still strong move = IF then price can break that Low Fibo at 0.9705. So, if that 0.9705 can be break too by strong bearish candle (from top) = Yes, I see = search for sell here = better. Look to the TCCI 96 = this TCCI 96 = till now still nice support for bearish too.
Regards.
Daily Technical Analysis for Friday, August 10, 2012 - by ForexPeoples.Com
EURUSD
The price on still sideways with bearish correction first. So, with this look - just wait and see and then, I see this price can bulls probably if truly the candle from bottom can break up to that more 1.2308 and or to break that strong 12321. we can see that TCCI 96 on still nice bulls.
GBPUSD
Till now, I still see that GU still go down form that supply area (1.5636) and I see the price more to probably bearish to test that pivot at 1.5624. But please note = the Big trend look to bulls first = can be see with TCCI 96 that till now show that bull line. On other word bulls on this pair can be start play IF truly price from bottom can break up to that strong resistance 1.5643. I see.
USDJPY
The USDJPY on still sideways - No nice idea to play this pair for now. Then, on my see the price want to try to test again that support (78.51). but, truly the price still look sideways and on my look = the Wait and see action = better.
USDCHF
Just be careful about probably price to be more bearish if the 76.4 fibo (0.9757) can be break by price from Top. On my simple analysis = the big trend on this pair now look on still bearish (TCCI 96 still look above the current price). So, if that 76.4 fib (0.9757) can be break by price from top = Yes, nice Sell continuation probability here, I see.
Regards.
Sunday, August 12, 2012 (analysis price for next opening price - tomorrow) EURUSD The price look sideways first near the 38.2 fib line (1.2287). On my see if on next price move - the price can be open bellow that 1.2279 (pivot) = Yes, this will be a nice trigger to become more bearish here, I see. GBPUSD The price look pullback down from that strong supply area (near the price 1.5680). On my see = as long as the price can not break up more to that 1.5700 (strong resistance on this pair) = the more probably price to bearish = here. of course. USDJPY Just be careful about price pullback up here - we can see now price was move above that strong and nice TCCI 96 line - and also before that = the price was pullback up from that strong demand area (near 78.19). So, of course - the more probably bulls for next price movement = can be probably here, I see. USDCHF The price look pullback up from that strong demand area (0.9756). And I see for now - price look want to try to break up that pivot at 0.9779. So, on my see = if that 0.9779 can be break by price from bottom = this truly will be more probably bulls trend continuation here and if that happen = search for Buy = better. Regards.
- Free trading apps
- Over 8,000 signals for copying
- Economic news for exploring financial markets
You agree to website policy and terms of use
Daily Technical Analysis for Tuesday, July 31, 2012
EURUSD
The big trend by look with TCCI - till now still on bulls, of course. But for today move, be aware of the bearish - I see the price try to test again to that 23.6 fib line (at 1.2195). So, of course - this could probably bearish first here till that 23.6 fib. But, for big move = this pair on still probably bulls = Once again = I see the TCCI 20day still give us a bulls pic to us.
GBPUSD
The bulls of this pair (GBPUSD) look difficult to up = it's because price now must break that strong supply area that now appear above the current price. So, I see this will probably to just consolidation first near that supply area. but, if we see to the TCCI = the TCCI still show the bulls and we can say this pair (GBPUSD) can start bulls again after truly price can break up more that supply area near 1.5717.
USDJPY
I see = the bearish trend still here (USDJPY) but with weak move after price now on near that support area (77.94). With this look = I see - it's better to just wait and see - then, we can sell again here after truly price can break more down to that strong support line (77.94), of course.
USDCHF
USDCHF on look bulls = we see the price candle on the previous day = look like bulls pinbar = So, yes = this can product bulls max. to test again that 0.9840. So, with this look = search for Buy OP on smaller TF = better idea, I see.