Linear SVM's for daily range estimation using Rapidminer
Setting the training range
The exporter has two parameters, FromDateTime and ThruDateTime. There was a time when I trained only on weekends, saved the model and ran that model over the week. After some testing it became evident that the best results from forex time series came from training everyday especially when there is a lot of volatility so that is what I do now. I usually estimate the Dollar index, S&P500 futures, Gold and Brent along with EURUSD, EURJPY and GBPJPY which are the currency pairs I like to trade. Thankfully, mladen added an automatic yesterday function to the exporter which means you can set it and forget it.
When ThruDateTime is set to some date in the future, it will automatically output the current bar which is ideal for outputting out of sample data. Now why not do this in Rapidminer? Well you can using a split data function which uses a ratio to split your training data and out of sample data but this method gives you more granular approach to dealing with dates.
To summarise, you will need two export history indicators on your chart, one for training data and one for out of sample data. Setting the Thrudate to the future will output the current bar. Keep in mind that training everyday has its draw backs in time. There is also nothing to say that the model generated will be any better than yesterdays but a lot depends on the characteristics of your time series.
Storing to the repository
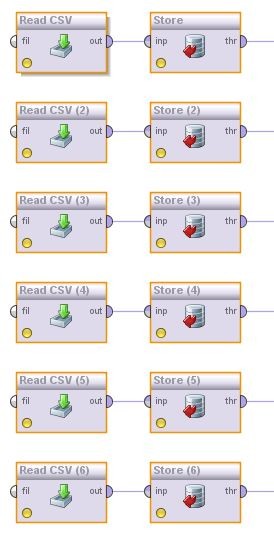
Once you have your csv files in order, it is time to store them to the rapidminer repository. This you can do in one shot using multiple load/store operations. I have attached a sample script. Ignore the header names and assign your own. As long you you remember which column of data corresponds to which indicator.
Hello!
Thank you so much for starting this thread. I will work on getting this running and understanding it over the next 2-3 days. It certainly doesnt look easy and I already have a few questions on how to get it running but will try first more myself. Hope you will be fine for us to ask a few questions here.
Cheers
Daniel
Hi Mr. Tools,
The Neuralmarket Trends videos are good for setting up the basic structure. I would highly recommend the video on genetic optimization for setting parameters. The idea is to use a grid of values and have rapidminer select the best values. I suggest doing this for windowing and c values. I will dig out the scripts to do this.
My only disappointment with the time series tutorial there is that the prediction trend accuracy is close to random. I would also argue with idea that neural nets and svms can't predict actual numbers. That is in fact exactly what we are doing here. Now I would take prediction trend accuracy with huge grain of salt. It is useful to point to see if your model is not spitting out random numbers but for real world optimisation it is not enough. The above model produces a prediction trend accuracy of between 72%-77% but you still need to have an idea of your average true range. I know right away that if for example GPBJPY is giving me a range of 100 pips then there is a problem with the model even though the trend accuracy is high.
The key here is a bit of planning. It is very important to determine what you are trying to predict and how are you going to test the validity of your results afterwards. The goal here was to have the svm predict take profit targets, not necessarily turning points although that does happen often. In the end, the output is only useful in the context of the trading strategy you are using.
There are a lot of ideas to look at here and I hope that this basic idea could evolve in many different directions with a little bit of creativity.
For fun here is the data for EURUSD for today calculated at the Asian session open. If someone would like to test this on something other than EURUSD, let me know.
Looking at the big picture
Not every currency pair responds well to this type of analysis all the time and there will be days like NFP where you can hit both the upside and downside targets in the same hour. Right now the S&P is conforming to the pattern prediction better than the forex pairs so that may be a better guide in some cases where futures are leading. Other things to look at are how many pairs and indexes are trading above their predicted pivot....Risk on!
1) I put Export History indicator in experts/indicators
2) I put the EURUSD Projected Pivot txt file you posted today in expert/files (just doing this today before learning to use rapidminer)
3) I open a EURUSD chart and put Export History indicator on it. Do I have to put in EURUSD under Currency Pairs in input?
4) Don't we also have to put pivots hf indicator (attached here) onto chart?
Please see image attached. Is this correct?
Thank you
Today the projected pivot is providing support in EURUSD. A more impressive snapshot again comes from the S&P where for the second day in a row, the SVM has correctly marked the high.
Hi Daniel,
Yes, you have to add the csv importer which will automatically draw the lines. It will read the projected pivots file from experts/files. For the moment, you will have to wait for me to send you the file. I suggest you start duplicating my setup in rapidminer following the image of the connections. PM me if you need help. I remember transferring things from one computer to another and it nearly drove me crazy. Considering you are new to rapidminer, it will be really helpful for the long term to understand the construction process. It took me a few months to get this working properly and it is something that is still evolving. Nevertheless, I should be able to save you a considerable amount of time.
The exporter will add a prefix such as ES_CONT, EURUSD etc so you don't have to think about it. Export the daily data and bring it in to Rapidminer. Rapidminer has a wizard for csv import. If my script does not work, then use the wizard. Take your time, Rapidminer has a million and one ways to get things wrong.
- Free trading apps
- Over 8,000 signals for copying
- Economic news for exploring financial markets
You agree to website policy and terms of use
First I would like thank mladen for his help with the csv importer and exporter. If you are running the estimation across many currency pairs, they are really a huge time saver. In this thread I will explain how to set the exporter, storing the data to the Rapidminer repository and lastly the svm scripts themselves.
To get things started, download Rapidminer 64bit from here Rapid - I - Download RapidMiner Community Windows 64 and create the rapidminer repository. Then run the exporter as indicator which will write a csv file to your expert/files directory. The exporter is setup to output five decimal places for EURUSD. To export EURJPY for instance you will have to set the OHLCfmt parameter to -T3.3 and for XAU or S&P500 futures -T4.2.
One important requirement is that Support Vector Machine learners need training data that has a wider range of values than the out of sample data in order to work. Looking at EURUSD this is not an issue as we do not have to go too far back to find a range of 1.1870 - 1.5140. If you chose this range as your training data, your results would be valid until your out of sample values exceeded that range. One way around the problem is normalization of values but first you have to decide what you are trying to estimate and decide if normalization will give you an output that makes sense.