PAL: Indicator of Current Market Sentiment
PAL mode: a shorter view
EurGbp
NMAs confirm down trend.
FDE says trending with possible move to more choppy times.
PAL looks to indicate lower.
So, even though the D1 looks higher, H1 points lower (8400?)
EurUsd

NMAs, FDE and PAL all point lower. Here, you probably choose between waiting for a slightly better entry (head fake retrace) or go ahead and get on the bus.
Despite the D1 view for higher, H1 indicates there's still some room to fall.
Here are the last versions of PAL; see Mladen's instructions in the Elite Indicator thread.
Standard disclaimers apply 
An additional disclaimer is that I profess no knowledge of the market nor where it is headed; I'm still trying to figure it out.
Here's hoping PAL can help you and that you can help PAL.
I eagerly await the ideas, comments, contributions and improvements that surely must be in PAL's future.
PAL mode
By way of introduction...
There are many uses for PAL, individually and in conjunction with other indicators.
One such use seems valuable - PAL Mode; it is formed by the Ocean NMAs and Fractal dimesion Ehlers (FDE). This template combines PAL and FDE and can be tough to read at first; FDE is the bold line, PAL, the narrow).
See the template for details and later post for more files.
ocn nma and fast ocn nma give a nice view of the trends and crossovers.
FDE provides a view as to the ranging or trending 'mode' of the market.
Then, consider PAL.
Note the 'early' change in sentiment.
For example, when FDE indicated the move to a trend (rolling over above 1.4, on EurGbp seen below, on 09.27) PAL indicated you wanted to be short when that trend started.
Looking at the D1...
EurGbp
The high FDE indicates ranging will soon end and a trend will soon establish (assuming the market does not like to stay in one place).
Hard to say at this point where the trend will go - PAL is not yet conclusive. However, area above 0 and existing trend portends a continued up move. (1.4000/1.6300=8600?). EurGbp could still very well dip down to hit the ascending trendline near 8330.
EurUsd
Extremely high FDE indicates choppy, ranging action; though continued weakness would signal re-establishing a trend. PAL seems to indicate a continued push higher (4000?)
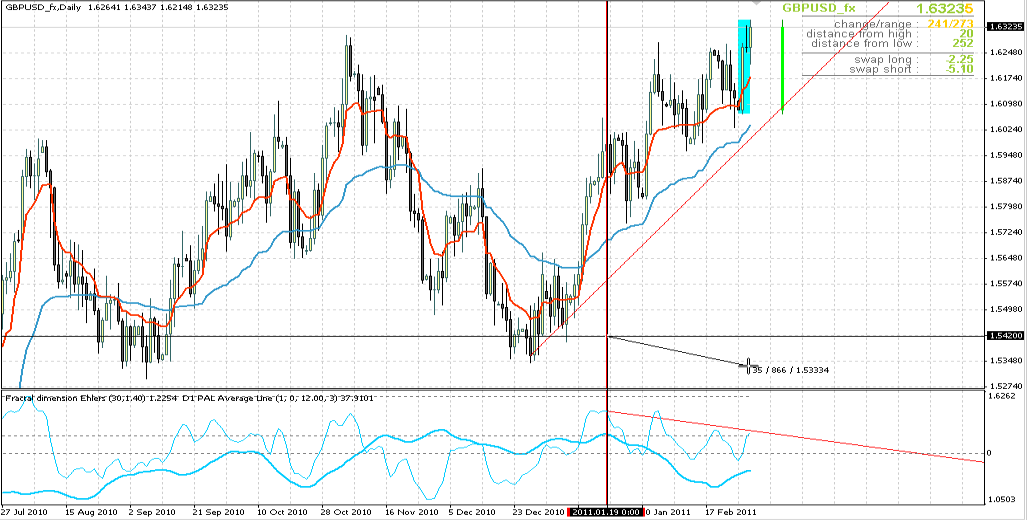
GbpUsd
Everything looks decidedly bullish (NMAs, FDE and PAL...6300?)
Up next a shorter timeframe view...
New version
This version adds a 'moderate' line as PAL Mod; it uses the Close instead of the H and L.
This has evidenced being up to a bar faster, in some cases, which seems useful enough to include it.
Depending on ShowValue parameter you are getting (where 'PAL a' denotes average) :
0 : PAL Line1 : PAL aLine
2 : PAL Span
3 : PAL aSpan
4 : PAL Area
5 : PAL aArea
6 : PAL Mom
7 : PAL aMom
8 : PAL Mod
9 : PAL aMod
10 : PAL TOW
11 : PAL aTOW
12 : PAL Dir
13 : PAL aDir
Thanx for info. And some Info how to use the FDE by Brian Brown
This Fractal dimension indicator is based on fractal analysis and Chaos theory and it was developed by John Ehlers and Ric Way. This trading indicator was introduced in the article "Fractal Dimension As A Market Mode Sensor" in the Stocks & Commodities magazine and it is a modified version of the fractal dimension index, which uses the time and price data to determine the trendiness or volatility of a given asset, market or security.
Fractal dimension indicator is a powerful technical analysis indicator that uses several functions to calculate a metric that will tell us the likelihood that the market follows a random walk. If the market is likely following a random walk then it will be very difficult to predict it using techniques such as technical analysis. In this case, it is better to search for and find another security or stock to trade, a one that is more predictable based on the Fractal dimension indicator.
The fractal dimension indicator can be interpreted as follows:
- A value between 1.4 and 1.6 suggests that the market is in a random walk and that it is unpredictable.
- Profit earning increases as the market deviates from the 1.4-1.6 range. This increase is proportional to the distance between the fractal dimension indicator value and the 1.5 level.
- The greater the deviation from the 1.5 level the higher the probability that the market is not acting randomly and that it is possible to predict future movements and therefore make profit.
Revisiting PAL D1
...for those keeping score at home...
Looking at the D1...
EurGbp
(1.4000/1.6300=8600?) The division was to establish range, not predict both EurUsd & GbpUsd would hit an extreme at the same time. EurGbp hit 8593 and got close to the TL (8330 estimate) at 8355
EurUsd
(4000?) 3890 as of today
GbpUsd
...6300?) 6344 as of today
Maybe luck. Maybe worth watching.
Good test may be coming up. D1 PAL indicates 35 days of GbpUsd weakness as though the runup is running out of gas.
need more explainatio
Hi..friend,
can u please explain me what is the meaning of blue box on the chart and what is the meaning of candle after the box....plz tell me where i can download this FDE indicator.
thank u ....
Hi..friend,
can u please explain me what is the meaning of blue box on the chart and what is the meaning of candle after the box....plz tell me where i can download this FDE indicator.
thank u ....Let's see..
Blue Box is Mladen's handy, dandy https://www.mql5.com/en/forum/178698
FDE is Fractal dimension Ehlers at https://www.mql5.com/en/forum/general
hi please update PalNd indicators . this virisions not work .
thanks
hi please update PalNd indicators . this virisions not work . thanks
soil82
Here is a new metatrader 4 compatible version of version 1.56 : palnd_v1.56_nmc.mq4
Dear Mladen,
I would like to test this indicator in an EA.
How to use this indicator iCustom?
I'm testing the code below is correct?
Thank you,
Rogério
double palmUp = iCustom(NULL,0,"palnd_v1.56_nmc","",ShowValue,Type,emaPeriod,AreaBars,SmoothLength,SmoothPhase,SmoothDouble,0,0);
double palmDn = iCustom(NULL,0,"palnd_v1.56_nmc","",ShowValue,Type,emaPeriod,AreaBars,SmoothLength,SmoothPhase,SmoothDouble,0,1);
- Free trading apps
- Over 8,000 signals for copying
- Economic news for exploring financial markets
You agree to website policy and terms of use
Thank you to the providers and members of this forum.
This forum has avoided the tendency to deteriorate into negatives witnessed on just about every other forum.
Perhaps that happens when you charge a fee.
The contributors and participants here are simply refreshing; a tip of my hat to Mladen in particular.
With little to offer in return, PAL is presented in hopes that those interested can help take it to its potential.
Disclaimer: a selfish motivation seeks to improve PAL results for trading before governments prevent our access to the markets.
Trusting the moderators can remove the thread if it proves worthless, here goes...
A picture is worth 1,000 words:
...a few more words:
PAL (PipsALot): near real-time indication of market sentiment with occasional leading indication
PAL (core value) is formed from the High-PreviousLow and Low-PreviousHigh
Combined and rearranged, the result is High+Low-PreviousHigh-PreviousLow (H+L-PH-PL)
In trends, the bias results in a positive value for ascending trends and negative values for descending trends
During ranging action or when transitioning between trends, the value is near zero
PAL essentially indicates the market sentiment – at the present time
Sometimes PAL is a leading indicator, the change in market sentiment is reflected in PAL before it can be seen in the Close
Other values derived from PAL and related parameters (all are works in progress):
As sentiment must occur first in lower timeframes, multi-timeframe views of PAL confirm strong sentiment changes
Credit Mladen for his extreme scrubbing and cleanup of the indicator(s).