The real problem with your trading system.
...
What software are you using?....
I think he talks about someone using 2M renko charts
heheh, 15M is very misleading-- people only use it for entry final confirmation, i.e. micro trend agreeing with the decision
last week, I got quite lot of fun with 150 MINUTE candle -- really 5 x 30M candle, as it go along the edges well with my 30M chart -- but 30M is also wrong TF, but I just invest too much time , indicators in my 30M templates, as I look at 1 hours, esp when 30M give you doubt, 60 is so easy
but I will read what he type again, another string theory of forex , I guess
What software are you using?....
this night help?
http://www.trading-strategies.info/system/files/ChartSetUp.pdf
what software are you using?....
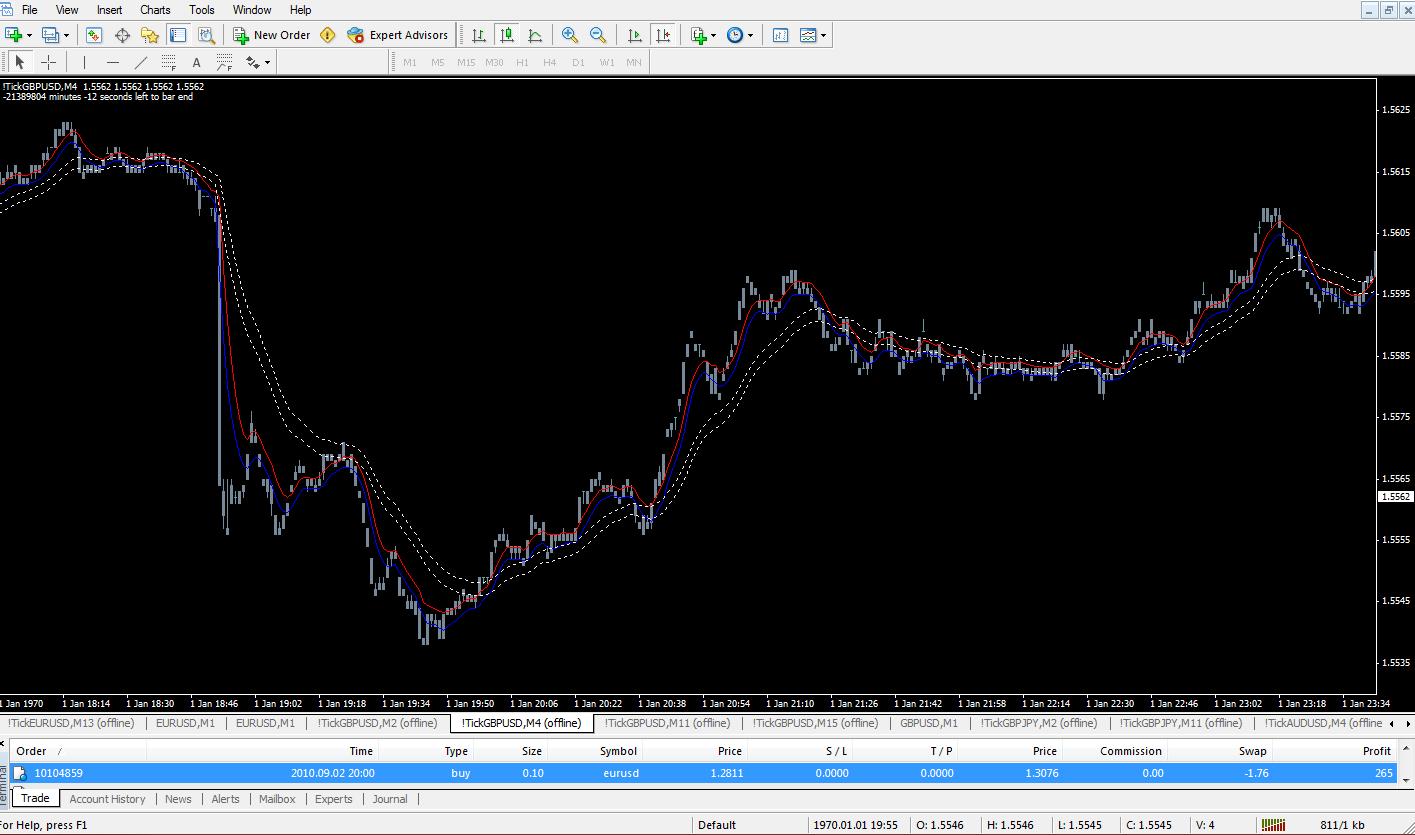
mt4.........
I think he talks about someone using 2M renko charts but I will read what he type again, another string theory of forex , I guess
This isn't "renko".
These are regular looking candles that are modified to only represent ticks.
If the candle settings are set at 4 ticks, than for every 4 ticks of movement, a new candle closes and the next begins.
The direction of the ticks don't matter. Just that there are 4 ticks, either up or down in price.
See these examples in pictures. Each candle represents an X value of tick movements.
I'm posting the following...
4 ticks per candle...
11 ticks per candle...
15 ticks per candle...
also the one minute....
This is immediately following a news announcement, when price is moving with a lot of speed and volume.
The lowest time frame offered on MT, one minute, has my same "channels indicators" as the tick charts do. And, that one minute chart simply was lagging much further behind than the tick charts.
After the big dip down...
According to my trading system , the earliest I could have bought on the 4tick chart was 1.5557 for a ride up of about 35 pips.
On the 11tick, I could had bought at 1.5555 for a ride up for about 40 pips.
On the 15tick, I could have bought at 1.5565 for a ride of about 30 pips.
And, on the one minute, according to my system, I would have bought at 1.5597 for a loss of 10 pips.
You can see how "narrow" the wave back up is on the one minute; and how "wide" it becomes on the tick charts.
As I said, a dissection of the market gives much more accuracy, and trading makes much more sense; and time frame trading is misleading. Hence, the reason why brokers only offer time frame candles.
can you share your tick indicator.
thanx
Thanks for sharing you make many valid points.
can you share your tick indicator. thanx
certainly. See attached files below.
Here are the instructions written by the author of the tick candles.
"After installing in your Indicators-list, do the following :
Open a simple M1 chart (EUR/USD if you want to trade this one)
Put the LogTickData-indicator on this "naked" M1 chart (enable DLL)
Drag the PostTickData-indicator into the same chart on the Price-window (enable DLL)
and choose your own preferred ticks per bar on the inputs-tab, (15 if you wish a 15-tick bar chart)
but 33 - 133 - 233 are more random tick charts and the 133 is the one i use most.
Then you open the offline-chart !TickEURUSD, M5 (leave the time as is)
This chart will start to collect tick data and you will see bars starts to form.
Wait until sufficient bars has formed, and then add your favorite indicators.
PS. Always leave the leading M1-chart open, don't close it !!
There is one big disadvantage on this system - once you close MT,
you must wait again building new data to produce a new actual tick
chart."
My words...
As the author mentioned, data is collected only in real time. So you must wait for new ticks in real time in order for the candles to form.
Leave your computer on all day and night. When you return home, there should be loads of tick candles for you to check out and configure your favorite indicators to.
You may or may not have to change you indicator settings since the candles are now measured differently than on a time frame chart.
To manipulate the amount of tick data in each candle, go into the "posttickdata" input settings, and change the number to whatever you like.
If you change the number of ticks, you must open a new offline chart each time you change the amount.
Any currently opened tick chart will just freeze until you switch the "posttickdate" input setting back to match that tick chart.
Or, simply open multiple charts with both indicators, and make as many tick charts as you like.
GodSpeed
Tick bars will not give you any edge what so ever. Meaning that tick bars are just an other way of looking to price as line charts or bar charts or candle sticks or tree-line-break charts or kagi charts or point figure charts, are other ways to look to charts and have their own logic.
And if you talk about time has no importance then you can put it a step further and that is that price moves should only be relevenant if there is also volume and then you can start to look to equivolume and candle volume charts.
All charts have their pro's and they all have their con's. After studying them for a while you gonna conclude that you will need to change the values of your indicators to come to the same results. But that you have not found an instrument that will produce more profit or less loss.
Just think of the renko chart... I believe we all had the feeling when we first looked to it that we thought EUREKA that is it. But very quickly you found out that it has its strong characteristics but that is has automaticly also its very weak characteristics.
But most important is that when you want to build yourself an EA, then you will get in serious trouble to program your EA the moment you start to use other bars then the default bars. Because in an EA the close of a bar is defined as the first tick that comes in of the new bar that is opened AND THAT TICK is related to time.
Friendly regards....iGoR
Tick bars will not give you any edge what so ever. Meaning that tick bars are just an other way of looking to price as line charts or bar charts or candle sticks or tree-line-break charts or kagi charts or point figure charts, are other ways to look to charts and have their own logic.
And if you talk about time has no importance then you can put it a step further and that is that price moves should only be relevenant if there is also volume and then you can start to look to equivolume and candle volume charts.
All charts have their pro's and they all have their con's. After studying them for a while you gonna conclude that you will need to change the values of your indicators to come to the same results. But that you have not found an instrument that will produce more profit or less loss.
Just think of the renko chart... I believe we all had the feeling when we first looked to it that we thought EUREKA that is it. But very quickly you found out that it has its strong characteristics but that is has automaticly also its very weak characteristics.
But most important is that when you want to build yourself an EA, then you will get in serious trouble to program your EA the moment you start to use other bars then the default bars. Because in an EA the close of a bar is defined as the first tick that comes in of the new bar that is opened AND THAT TICK is related to time.
Friendly regards....iGoRTo each his own.
The tick candles can be converted into bars or lines. I don't see your point in mentioning them. Bars are basically just like candles, and a line graph is simply a moving average line.
Volume is fine, but we are not talking about candlevolume charts. Candlevolume charts represent price and volume data in each candle stick; and are better suited where there is an actual dealing desk, such as the stock market.
Without a dealing desk, we can't know the actual "volume" of the other trades that are occurring.
The forex market isn't measured in volume in the same way as stocks. Volume in the forex is tick-based and merely shows an increase or decrease in trading activity. Which, just put's more emphasis on the usefulness of a candle tick chart.
Furthermore, the whole market is intertwined. A strong currency is going to be strong against more than one other currency, regardless of whether there is actual equal volume being trades against any of the other currencies, and vice-versa for a weak currency. Huge swings of a currency pair can affect another currency pair simply because of the currency crossings.
To use candlevolume charts as they are intended to be used, one would have to know exactly where and how much actual volume is being trades, or if it is a mixture of volume on various currency pairs. And, that is just not possible. The market is too big, too intertwined, and there is no dealing desk.
Do you actually use candlevolume charts in the forex?
Unfortunately, you are comparing to renko and EA's. And the market isn't measured by either.
If the EA that is programmed is to use regular candles, than certainly it is related to time; because that is what determines the open and close of a regular candle. But, why is mentioning EA coding the "most important" point to make?
And unfortunately, I already gave evidence of "the edge" with the screen shots; which would have given a much earlier entry point.
A good system would improve with tick candles.
A bunk system would not.
If you're system helps you make money, than by all means use it.
Let's just not be too set in our own ways and try to argue about something that can help others improve their trading.
- Free trading apps
- Over 8,000 signals for copying
- Economic news for exploring financial markets
You agree to website policy and terms of use
Greetings. I must tell you, newbies and those who haven't done their due diligence, about what the problem may be with your trading system.
After reviewing some, not all, of the offered trading system here, it came quickly to my attention that few mention the use of a tick chart and/or tick candles.
( I'll speak under the assumption that most use candles on their charts; as opposed to line or bars or other (i.e renkos).)
First...
Time is constant, yet doesn't even truly exist. I don't mean in a philosophical way; but rather in the trading market. From Sunday open to Friday close, the forex market is one very long trading day. And chances are that your current broker only offers "time frame" candles.
The big problem with this is, for traders, is thatthe market isn't measured in time, or time frames. It really may seem that way; but it's not.
Perhaps some have gotten so accustomed to visually seeing their charts in time frames, that it became a regular and unconscious belief that that is just how to trade; in time.
Take a look at your chart. Any time frame; let's example with 15 minute.
Tell me what happened inside of that 15 minute 40 pip candle. What about that 15 minute 20 pip candle? And what about that row of flat and/or ranging candles? At best, most could only answer that each candle lasted the same amount of time before the candle closed.
This presents a problem. Why? Simple. Who has ever cheered because they were in a trade for the full 15 minute candle? Who ever cheered because they made it through two 30 minute candles before the exited the trade? And how many have cringed because the moment they entered their trade, the market stalled and ranged for 2 or more straight hours!?
Problem is that measuring with and/or in a "time frame" is not accurate; not even close.
Sure you might get a fair idea of the next trend direction, or even maybe some indicators might fire off some reasonable signals. However, the market is not measured in time and most indicators simply lag because of it.
Some indicators are a mix of time and price movement, but waiting for the candle to close is what causes the problem. The candle may or may not close with the indicator holding it's signal. The indicator might re-paint. Or even worse, the price already jumped 30 pips, and the candle isn't even close to closing.
Second...
You must let your trading system "agree" only with the actual and important measurement; namely, price.
The Y-axis is what counts. The Y-axis is what should be used for best measurement and results. We cheer for making pips and any positive amount. We cringe for negative pips. Enough said.
The candle tick chart offers an unprecedented way to really "dissect" that whole 15, 30 , 60, etc., minute gap of time. It is literally like an opening up and peaking into the markets fine tuned movements. The candle forms because X amount of ticks in price has occurred, not simply because X amount of minutes passed. When using a tick chart, trading makes a lot more sense, and indicators are much more accurate.
I've been using tick charts, and I've never gone back to time frame trading.
I can modify the candle to represent as low as 2 ticks . I haven't used passed 100 ticks, but certainly it's possible.
In other words, instead of the candle representing a range of time, it represents X amount of movements in the price.
Makes more sense, right?
You want pips? Make your system and indicators measure only in pips (ticks).
For short term scalpers, as low as 4 ticks could give some 10-60 pips moves.
A 10 - 20 ticks is comparable to a 1 minute chart, yet much smoother and cleaner. (amount of ticks depends on currency pair)
A 35 or 50 ticks is comparable to a 5 minute, yet also cleaner. (amount of ticks depends on currency pair)
For long term traders, even better. And better than ever.
Just up and tweak the math, and make the comparison.
Third....
Your broker doesn't offer tick charts because of these very reasons. Time frame trading presents much more risk and inaccuracy. Indicators lag and low quality indicators constantly re-paint. Which, is good for them and bad for you.
My best advice, let your candles be measured in ticks rather than time.