EA to make a chart from the open balance...
Here is the simple but decent library which will create such a chart based on equity.
should go to experts/headers folder. Library is fully commented by author can be integrated into indicator or create a new indicator based on such library or even EA
Hi Guyver,
Thanks for your contribution.
But there is of course quite a lot of work to do. Which I am not cappable of.
A ready steady to go EA or indicator is the thing I'm looking for.
But again thanks and maybe it can give help to somebody else to make this.
Friendly regards...iGoR
I have found something that is helping but is of not a real help.
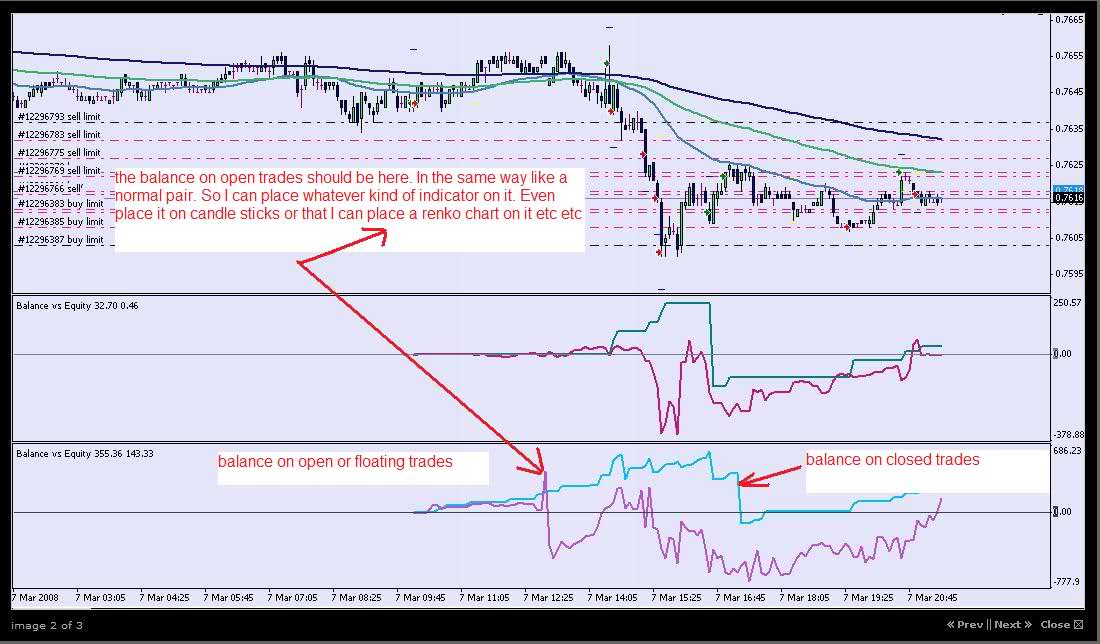
In the indicator window it shows indeed the chart on the open balance. But in that window one can not place indicators on that "indicator".
So that magenta line which is the equity on floating balance should be in a MAIN window. So that one can place whatever kind of indicator on it. Even change the line to candle sticks or place fibonaci levels on it etc etc...
Exactly the same as it would be any normal pair.
Hope this helps...
Friendly regards....iGoR
PS. The line in the chart of the floating balance is very jumpy but that is because it is showing the flaoting balance of only 1 pair traded (eurusd). There is no use of placing indicators on such a "chart". But if one would trade many pairs then of course the line will be a smooth and reliable to place indicators on it.
- Free trading apps
- Over 8,000 signals for copying
- Economic news for exploring financial markets
You agree to website policy and terms of use
Hi,
Is there an EA or indicator that can make a "new" chart based on the floating balance ?...
To explain a bit: lets say that one trades 10 pairs simultaneoulsy. The 10 trades are all open. That is generating an open balance or floating balance.
That open balance goes up and down in value.
If an EA or indicator can make a chart from this floating balance then one could place indicators on that "new" chart. So lets say that one would place
a stepMA on that "new" chart and that chart goes up and up because the floating balance goes more and more in profit. At some point the floating balance starts to drop again because of giving back profit then the StepMA is going to give a short signal on the "new" chart. The moment it gives a short signal we close all positions. A step further could be that one closes all trades and takes in opposite trades. Which will generate again a "new" chart.
I believe that the equity curve or new chart on the open balance should be quite smooth and stable because the "new" chart is a combination of the result on 10 pairs or 8 or whatever amount.
To use this only on 1 or 2 pairs will not make any sence because that chart will be to jumpy like the price of a pair itself.
I hope this makes sence....
Friendly regards....iGoR