an EA that makes a chart from open balance.
I have found something that is helping but is of not a real help.
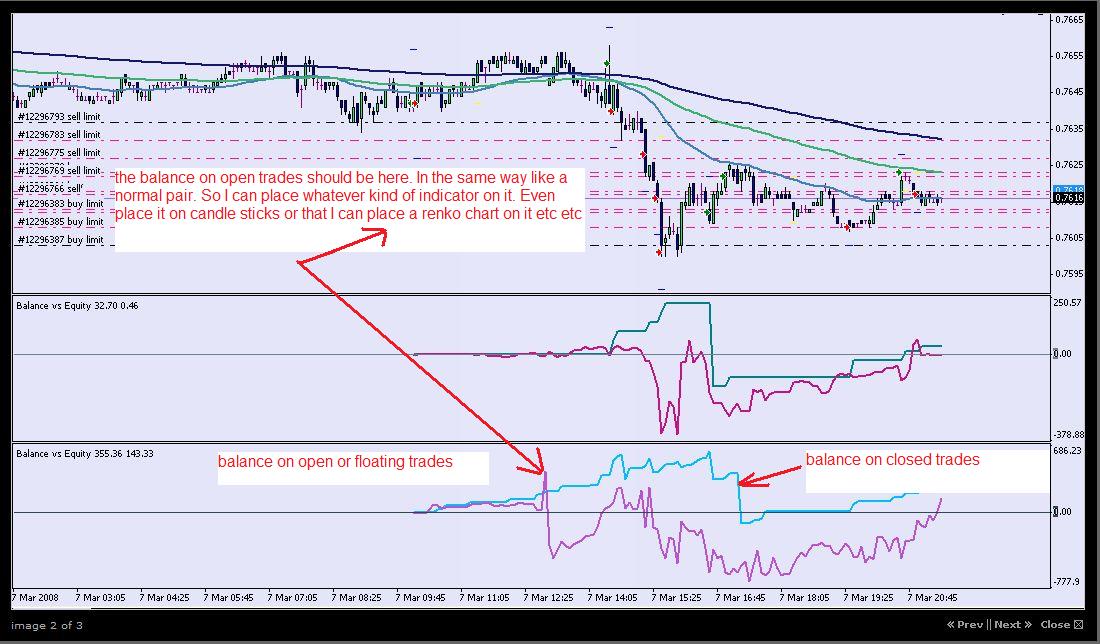
In the indicator window it shows indeed the chart on the open balance. But in that window one can not place indicators on that "indicator".
So that magenta line which is the equity on floating balance should be in a MAIN window. So that one can place whatever kind of indicator on it. Even change the line to candle sticks or place fibonaci levels on it etc etc...
Exactly the same as it would be any normal pair.
Hope this helps...
Friendly regards....iGoR
PS. The line in the chart of the floating balance is very jumpy but that is because it is showing the flaoting balance of only 1 pair traded (eurusd). There is no use of placing indicators on such a "chart". But if one would trade many pairs then of course the line will be a smooth and reliable to place indicators on it.
[IMG]http://i46.tinypic.com/2lx82vs.jpg[/IMG]
Hi iGor,
if you code than I'm sure you can modify from these
'equity' search top 3 :
https://www.mql5.com/en/code/8454
https://www.mql5.com/en/code/8588
https://www.mql5.com/en/code/9343
Best
cameo
Hi Cameo,
Thanks very much for your contribution and help.
When I read over the 3 links you gave then this link is the one that is the big step in the right direction https://www.mql5.com/en/code/9343
It is indeed making a chart from the equity curve so one can do a technical analysis from the equity curve and even change it in candle sticks.
But this solution is making a chart from the closed positions. So what I am looking for is that we could make a chart from the open balance.
Unfortunaly I can not code in mql. (only in matestock professional ). So I can not change the code from that solution to make it work for open
balance instead of closed trades.
So if somebody could be of some help then thanks A LOT in advance.
Friendly regards.... FXiGoR
... lets say that one trades 10 pairs simultaneously. The 10 trades are all
open. That is generating an open balance or floating balance.That open balance goes up and down in value.
If you are generating this from ~ 10 or so simultaneous trades of different currency pairs amalgamated together, isn't it going to be out of kilter and not accurate to any one or more of the particular positions? Wouldn't you have to make a 'new' chart for each specific trading currency pairs for it to be accurate and relevant to it?
I suppose in the overall trading, this MAY be profitable; even though you may be closing out some of the trades out at (significant) losses?
- Free trading apps
- Over 8,000 signals for copying
- Economic news for exploring financial markets
You agree to website policy and terms of use
Is there an EA or indicator that can make a "new" chart based on the floating balance ?...
To explain a bit: lets say that one trades 10 pairs simultaneoulsy. The 10 trades are all open. That is generating an open balance or floating balance.
That open balance goes up and down in value.
If an EA or indicator can make a chart from this floating balance then one could place indicators on that "new" chart. So lets say that one would place a stepMA on that "new" chart and that chart goes up and up because the floating balance goes more and more in profit. At some point the floating balance starts to drop again because of giving back profit then the StepMA is going to give a short signal on the "new" chart. The moment it gives a short signal we close all positions. A step further could be that one closes all trades and takes in opposite trades. Which will generate again a "new" chart.
I believe that the equity curve or new chart on the open balance should be quite smooth and stable because the "new" chart is a combination of the result on 10 pairs or 8 or whatever amount.
To use this only on 1 or 2 pairs will not make any sence because that chart will be to jumpy like the price of a pair itself.
I hope this makes sence....
Friendly regards....iGoR