Eternit - RAS ID: 21768
Appropriate Strategies
Some trading strategies would be labelled, some Enter & Exits will declared.
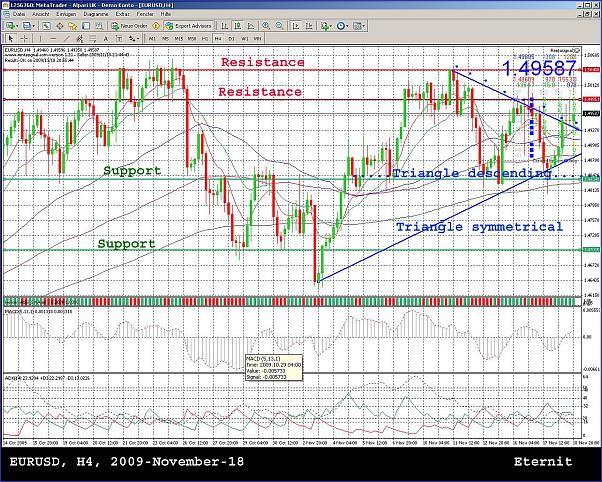
EURUSD, H4 - Support - Resistance
EURUSD, H4, 2009-November-18
Triangle
When a pattern develops that display a series of peaks that are progressively lower and a series of higher troughs, it generally indicates that indecision exists in the market. Usually, the price will break out of the pattern with an equal amount to the base of the triangle and in the same direction as the original trend. Just like with symmetrical triangles, the move from the apex to the equal base of the triangle can be expected.
further information:
http://www.forexrealm.com/technical-...gle-rules.html
Support and Resistance Levels
If you are going to invest in online forex currency trading, you will be reading a great deal of Forex charts. Forex Support and resistance levels are important concepts that are quite commonly used when trading online.
Imagine a standard online Forex bar chart that details the price movements across a time period. You will notice that the chart moves inside a certain border that can be framed. This frame constitutes the support and resistance levels.
Support levels are horizontal lines that define the price at which most traders feel the prices will move higher. You can pin point support levels by viewing the day's lowest prices. These lows usually fluctuate around a certain point - which is where the support level is located.
Resistance levels are horizontal lines that define the upper level of trading, the place where there are more sellers than buyers. This is because when the currency reaches the resistance level, it is expected to drop.
What if support and resistance levels are broken? If support levels are broken, they often become new resistance levels, because the currency fails to reach its precious lowest level. If resistance levels are broken, they sometimes continue to rise high above the previous resistance level.
A common forex trading strategy uses Forex support and resistance levels to set the placement of stop loss and take profit limit orders.
see:
Recognizing and Using Forex Trading Support and Resistance Levels
Risc Warning
Risc Warning
It is possible that you can lose all of the money you deposit, and in some circumstances you may even be required to deposit additional sums to cover your losses. By undertaking these types of high risk trades you acknowledge that you are trading with your available risk capital and any losses you may incur will not adversely affect your lifestyle.
Eternit - Manual Trading System
Eternit - Manual Trading System
Result
Manual Trading System Switzerland - Eternit
Deposit: 25'000.- $
Beginning date: 2009 November 16
Target: 0.125% per day.
Update
since 2009 November 16
Equity: 28'803.09 $
Profit: + 3'803.09 $
- Free trading apps
- Over 8,000 signals for copying
- Economic news for exploring financial markets
You agree to website policy and terms of use
Eternit
Manual Trading System
RAS ID -21768
Eternit has an active manual forex trading. Different trading strategies are taken in account.
Currencies: all
Timeframes: all
Thought has been given to:
Indicators
EMA's, ADX, RSI, MACD, Parabolic SAR, Stochastics, Bollinger Bands, Pivot Points, Fibonacci Levels, ...
Strategies & Trading Styles
EMA-4-MTF, Trendline-/ Range-Trading, Picking Tops & Bottoms, Breakout Systems, Fibonacci Trading, Midnight setups, Candle Strategies, Floor Trading, Simple Trading with Daily Range, Multi-conditional Trading, 2-Cross Trading, MACD-Divergence-Trading, CCI Divergence Breakout, Bollinger Band Deviation, ...
Check out the account results and do not hesitate me with questions or requests for additional details.
Kindest regards
---
Update:
Demo Account MT4
Account Balance: 25'000.- $
Beginning day: 2009 November 16
Trading Style: Normal Risc Level.
Target 0.125% per day.
Depot at 2009 nov. 19 - TOTAL: 28'803.09 $
Profit since 2009 nov. 19: + 3'803.09 $
see attachment # 4