Nice, ... but ...
Hi all members,
Here's a very simple setting which I want to share. Those who like clean charts would love it!
Standard indicators used:
RSI (5): blue line
Stochastic (5,3,3): red line (only main line)
Entry Signals: when RSI line has a clear break and goes in the Stock direction.
Filters: both lines must point the same direction before the clear RSI break and the Stoch not in the overbought/oversold area.
The exit strategy has to be find but a simple TP/SL/trailing will catch some good pips.
I didn't trade it yet, just come across this setting recently.
Hope you will have fun with it!
FerruFxHi.
Thanks for the time taken to share this. Really does look nice, but the points where you put your arrows don't seem to show only breaks; i think some were also just crosses. Did you actually mean "crosses"?.
I do also envisage a little problem with identifying the crosses/breaks and filtering them from false ones as you tried to point out: subjective interpretations. The rules of breaks don't look well spelled out. If i knew how to re-post charts, i'd have done so to point out other breaks you didn't see which were similar to your rules but turned out wrong.
Sorry if i sound like a critic; i only wish the rules/filters were clearer.
Sorry if i sound like a critic
Don't be sorry. We are all here to discuss.
By "break" I mean when the RSI change brutaly is direction and is close to the Stoch line. Cross is not necessary but will be close.
I pointed on the pic an example of false signal: when both lines move together and cross smoothly.
Keep in mind that I didn't claim that there won't be loser. This post is just starting and all suggestion and remark are welcome.
Thanks for your interest.
FerruFx
Looks very nice!
Don't be sorry. We are all here to discuss.
Keep in mind that I didn't claim that there won't be loser. This post is just starting and all suggestion and remark are welcome.
Thanks for your interest.
FerruFxThanks for sharing your idea FerruFx. Can you please post your template?
Thanks for sharing your idea FerruFx. Can you please post your template?
Sure ... Attached!
FerruFx
Sure ... Attached! FerruFx
Thanks a bunch FerruFx.
Sure ... Attached! FerruFx
hi.this is my first post in forex-tsd forum. excuseme because i don`t know english good.
thanks ferrufx for sharing. i use it but by different model and use bollinger bands for hope to enter ant exit.
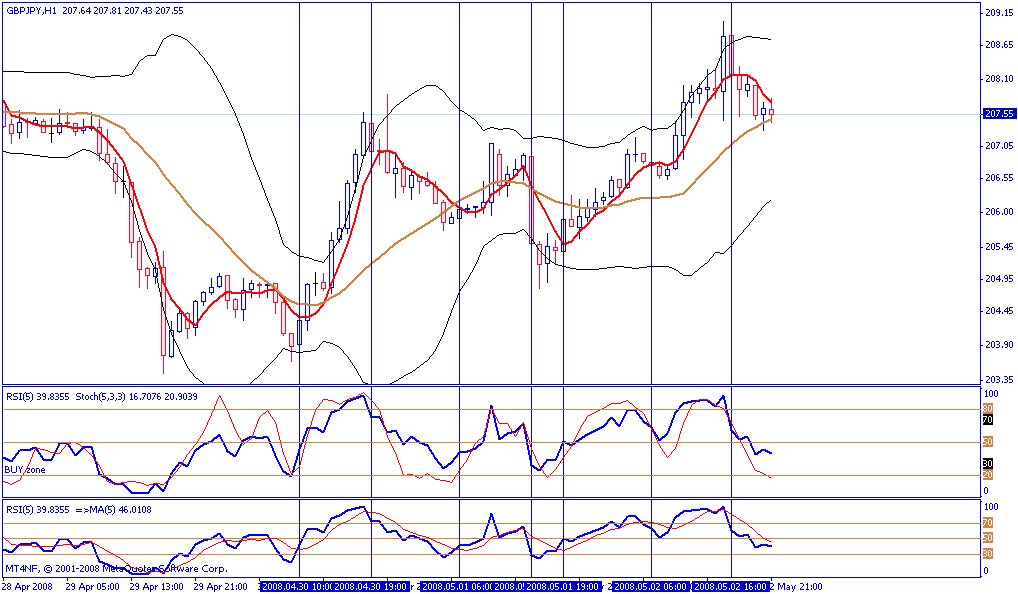
Hello FerruFX and friends here, give me a try to give another clear chart.
1. BollingerBands with period=20 ; deviation=2. Color Black with middle line Peru color.
2. Simple Moving Average period=5, Apply to Close. Red color.
3. RSI period=5, Apply to Close. Blue color
4. in RSI window, please add Simple MA period=5, Apply to "Firs Indicator's Data". Red color.
May be this will be clear entry for you.
For more understanding, please see the chart. Vertical Blue line is entry conditions.

Looks familiar
Sure ... Attached! FerruFx
Hi FerruFx.
I have the identical setup for the higher TFs. Indeed it is clean, simple and profitable. Reminds me of another one I saw from an Australian service that uses just a MACD in conjunction with Fibs and generate hundreds of pips/day. So, simple definitely has proven itself.
Thanks for sharing,
My screen looks different.
Just open your "navigator" window, then "indicators" list and drag and drop the stochastic oscillator in the RSI window. And set it to 5,3,3.
Hope that helps.
FerruFx
- Free trading apps
- Over 8,000 signals for copying
- Economic news for exploring financial markets
You agree to website policy and terms of use
Hi all members,
Here's a very simple setting which I want to share. Those who like clean charts would love it!
Standard indicators used:
RSI (5): blue line
Stochastic (5,3,3): red line (only main line)
Entry Signals: when RSI line has a clear break and goes in the Stock direction.
Filters: both lines must point the same direction before the clear RSI break and the Stoch not in the overbought/oversold area.
The exit strategy has to be find but a simple TP/SL/trailing will catch some good pips.
I didn't trade it yet, just come across this setting recently.
Hope you will have fun with it!
FerruFx