Picture 1: Explanation about indicators.
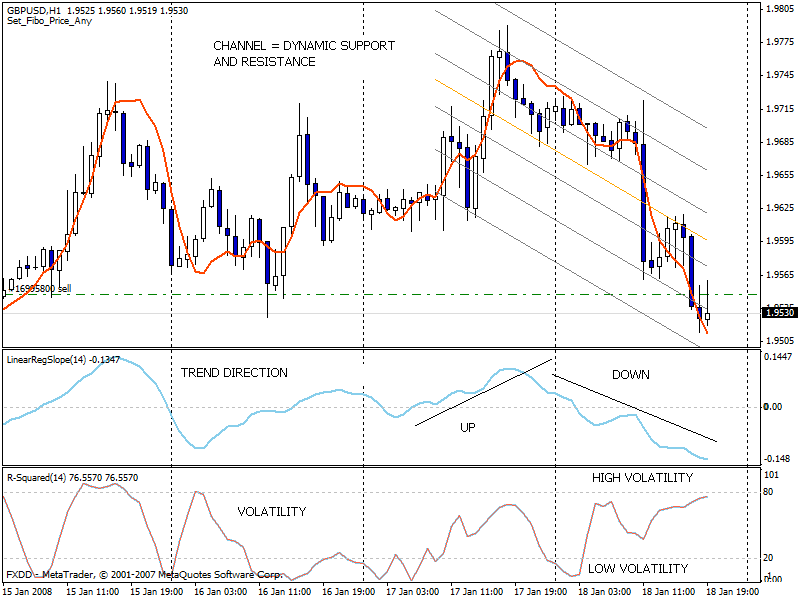
LinearRegSlope indicator fluctuates a round a zero line.
It display for things:
1-When the line is below zero line and is pointing down, trend is absolutely negative. Candles are below the center of the linear regression line.
2-When the line is below zero line and is pointing up, trend is negative. Often Candles are above the center of the linear regression line.
3-When the line is above zero line and is pointing down, trend is absolutely positive. Candles are above the center of the linear regression line.
4-When the line is above zero line and is pointing up, trend is postive. Often Candles are below the center of the linear regression line.
PICTURE: TREND TRADES
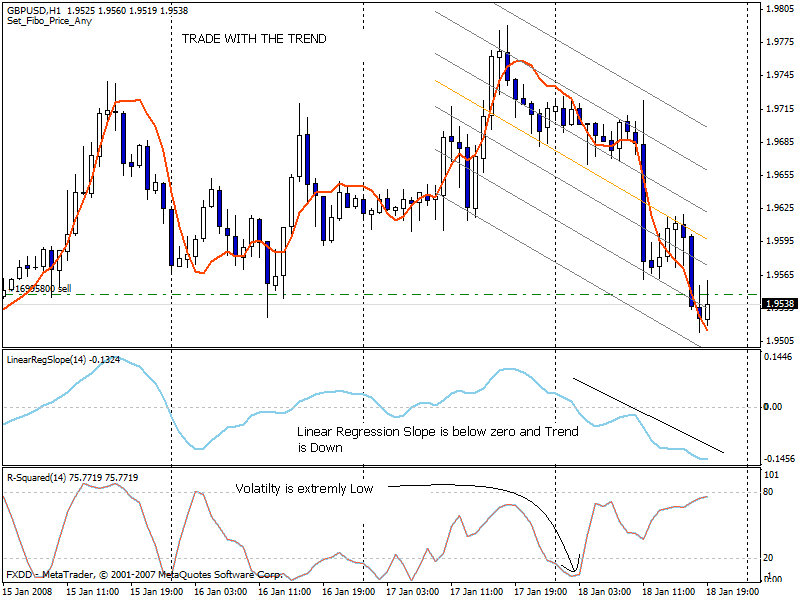
Picture 5: Entries and Exits. Also, counter trend trades.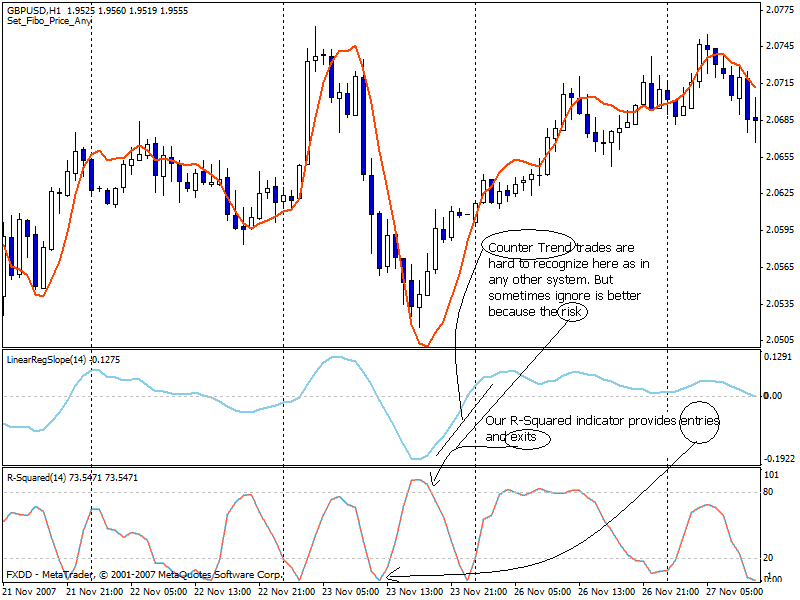
Picture 6= Adding level 10If you prefer you could a 10 level to R-Squared and minimize the risk. Taking only that trades when the R-Squared indicator crosses this level.
If R-Squared is "flat" at zero level you would have the best trades.
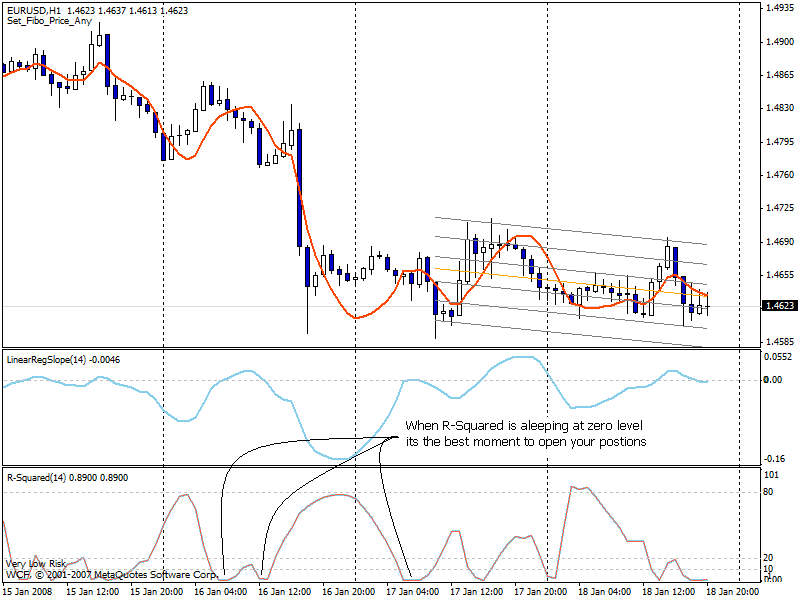
First Trade
By look the last picture on the previous post we could see all elements aligned and giving us a short trade.
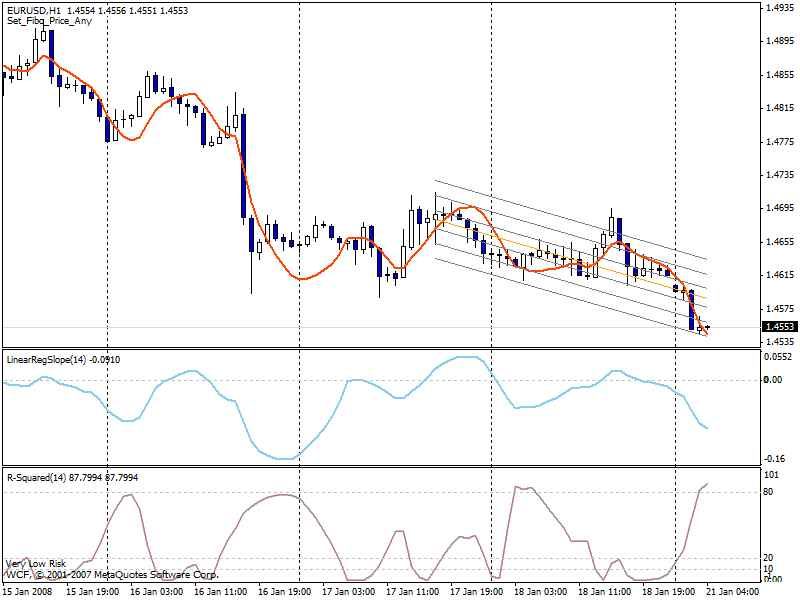
Our Channel is pointing down, LinRegSLope is below zero and pointing down and R-Squared is sleeping near zero.
By entering short at some point between 1.4600/20 and set our Stop at we could exit right at this moment when R-Squared is reaching the top level and cash 50/70 pips or wait some hours targeting 1.4500.
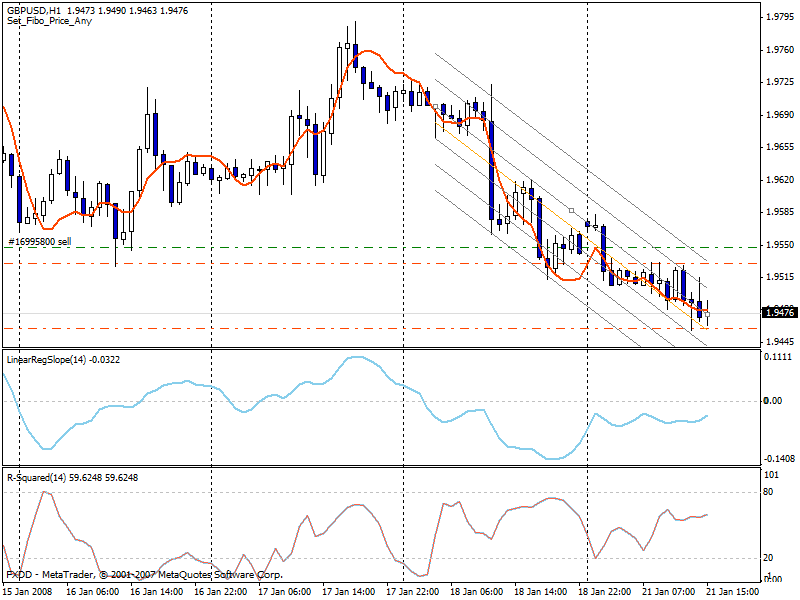
About GBP, our SL was moved to breakeven point, Our target is 1.9480.

First Trade Almost done.
A couple of minutes ago we moved our SL to 1.9530 to keep a small profit and set a new target to 1.9460 near the low of the day. If you had set our previous 1.9480 target your trade is happy in profits for today.
If you didn't. You could close the trade now without see the R-Squared because we do not to have American session and London is almost done.
Our Euro trade is having profits too. Our 1.4500 target was hit.

We have a short signal today. See picture for details. This trade is a little out of time but it have potential.
If prices keep going down we could move our SL to 1.4650 first and then to brakeven. If R-squaed touch extreme 80 level we are going to exit.
We have a short signal today. See picture for details. This trade is a little out of time but it have potential. If prices keep going down we could move our SL to 1.4650 first and then to brakeven. If R-squaed touch extreme 80 level we are going to exit.
Well, a nice day a little profit and low risk trades. The best is our SL is safe even after having moved to a new level.
However our target was not hit and for Finonacci traders price just bounced back on 50% retracement.
Day is almost over and the idea to pay rollovers for a couple of hours dislikes me. Se, we can close our trade here with 30 pips profits for safe.
We had lot of possible trades in several currencies today but I decided for this classic.
Remember, in this thread you should not see how well works this system in past time, writing the trades after they happened.
The idea is to learn and develop together and the only way is by posting the trades before they happen. Also you have a free signal commentary 
See you tomorrow.
Euro is Flat
The euro is flat during Asian Session. All Indicators are flat.
We will have a interesting move in a couple of hours.
We could set a couple of orders.
- Free trading apps
- Over 8,000 signals for copying
- Economic news for exploring financial markets
You agree to website policy and terms of use