You are missing trading opportunities:
- Free trading apps
- Over 8,000 signals for copying
- Economic news for exploring financial markets
Registration
Log in
You agree to website policy and terms of use
If you do not have an account, please register
Wow, its 5 years since i posted on this thread, 3 years since last post !!!!
And I strongly believe that is is one of the most important threads if not the most important in whole forum !!!
Simply speaking: If Time Series are not tradable (e.g. random) than all systems will fail. If they are tradable even simple system will make money.
2 documents to revive this thread with some insights of FOREX data.
See also http://docs.mta.org/journal-ta/2013-journal.pdf
A Synthesis of Technical Analysis and Fractal Geometry
Krzysztof
Thanks for posting those Fajst_k
This is the part I like the best from the second article...
"In particular, in order to explain such a financial environment, we can conjecture that the corresponding foreign currency markets are characterized by the arrival of conflicting information. This causes very different and, often, incompatible behavior among the economic agents."
I think anyone who has traded FX for a month has already figured this out.
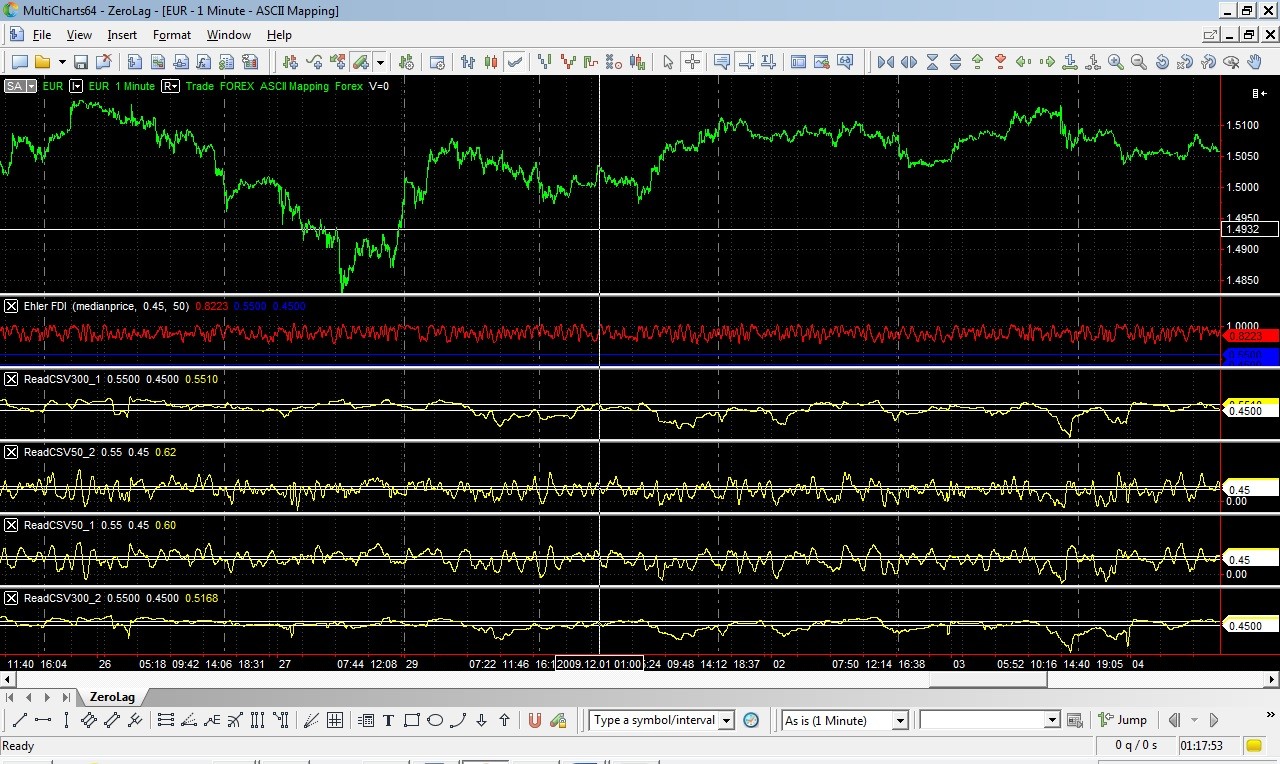
So here is my 1st attempt to do something in this area. I generated values of Hurst exponent for 1 min EURUSD data from december 2009 using MATLAB function wfbmesti, it generates HE values using 3 different methods.
clear all
load('EUR A0-FX.mat')
length = size(Close,1);
lookback = 300;
Hest = zeros(length,3);
for m = length:-1:lookback
j=0;
for i = m:-1:m-lookback+1
j = j +1;
x(j) = Close(i);
end
Hest(m,:) = wfbmesti(x);
end
% Compare empirical distributions
subplot(311), hist(Hest(:,1));
title('Discrete second derivative estimator DSOD')
subplot(312), hist(Hest(:,2));
title('Wavelet version of DSOD')
subplot(313), hist(Hest(:,3));
title('Wavelet details regression estimator')
I made this for 2 lookback values 50 and 300 bars than i transferred this data to Multicharts to compare with Ehler FDI indicator and sevcik HE estimation. See screenshot for results. Original values of HE obtained from MATLAB was
strongly smoothed otherwise they were too noisy.
For me is clear that HE calculated in this way i.e. directly from financial time series is useless for trading. Just by visual chart analysis there is no common pattern like e.g. flat market and HE<0.5. Regarding Ehler HE. I just obtain it from his Fractal dimension indicator
by HE = 2 - FDI and plotted. Its clear that this value has a bias so its not really HE value maybe because he smooths data before calculating FDI
Krzysztof
and here is a screen of HE (2-FDI) from Ehler with and without smoothing. In both cases values has a bias so for sure it is not HE values. Is he really does those calculation correctly ?? I'm very curious if he tested this indicator on fractional Brownian motion series with known HE.
Krzysztof
some new things about using Hurst for trading. Does anybody heard about this ??
https://www.youtube.com/watch?v=x_JcExwuu60
Krzysztof
some new things about using Hurst for trading. Does anybody heard about this ??
https://www.youtube.com/watch?v=x_JcExwuu60
KrzysztofKrzysztof
I wrote once that a few years ago I found a German paper with a mathematical proof that Hurst exponent can not be applied to financial time series. Unfortunately I did not keep the paper, can not reproduce it (just read it and took it as is) and now I fail to find that same paper on the net
If I find it, will post it
Maybe helps (something similar) : is_hurst_exponent_value_useful_in_forecasting_financial_time_series.pdf
Maybe helps (something similar) : is_hurst_exponent_value_useful_in_forecasting_financial_time_series.pdf
Interesting...that article is supportive of using the Hurst exponent. I have tried many times to use it without success.
Maybe helps (something similar) : is_hurst_exponent_value_useful_in_forecasting_financial_time_series.pdf
Thanks But what I was referring to was similar to this (this just summarizes the whole thing without actual math proof, once I found that German paper with an actual math proof for the thesis) : Can Hurst exponent be used to characterize nonlinear dependence in time series? - Quantitative Finance Stack Exchange