The 3 Duck's Trading System

i think you'll get the same result by using;
5 SMA
60 SMA
240 SMA
on a 1hr chart
i think you'll get the same result by using;
5 SMA
60 SMA
240 SMA
on a 1hr chartHello trevman,
Yes, You can also get the same by using a 60 sma, a 720 sma and a 2880 sma all on the 5min chart. I just prefer to look at 3 charts rather than 1, it helps with stop-loss locations & enteries but thats just me!
Kind Regards,
Captain Currency.
hi
The 3 Duck's Trading System
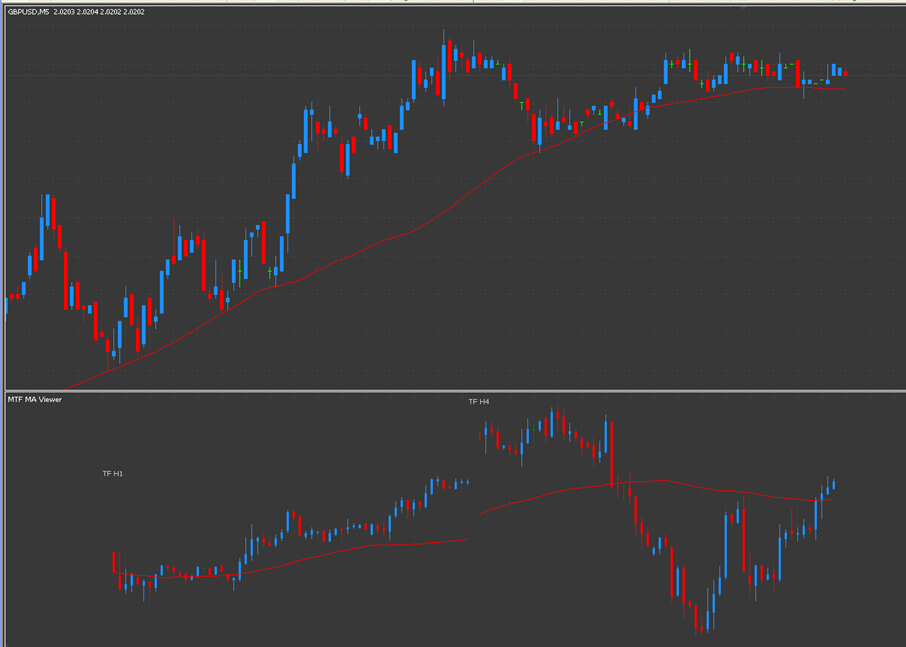
Firstly I would like to say, I did not create or invent this system, I have just added one or two ideas to make it my own and named it "The 3 duck's Trading System" for obvious reasons as you will find out later on. The system is fairly straight forward and easy to use. Like a lot of trading systems it will be more productive when prices are moving in one direction and not stuck in a tight trading range. Of course this system has losing trade and losing runs, but with proper money management and good discipline I'm sure this system will keep you out of bad trades and give you a great chance to make profits in the Fx market. One of the nice things about this system is it will quickly tell you if prices are in an up or down swing phase and stop you from guessing! It will also allow you to decide to be a bull or a bear and trade in the direction of that trend. There are 3 charts involved in this system: a 4hr chart, a 1hr chart and a 5min chart. There is 1 indicator, a 60 period simple moving average (60 sma) plotted on each chart. There you go, its that simple.
How it works:
Step 1 - First Duck
The first thing we need to do is look at our largest time-frame (4hr chart) and see if current prices are above or below the 60 sma. From this chart we can see that current price is below the 60 sma. This tells us that we maybe looking to sell.
Step 2 - Second Duck
The second thing we need to do is drop down to our 1hr chart. We need to see the current price below the 60 sma on this chart also, this gives us confirmation.
Important: If the current price was to be above the 60 sma on this chart we could not move on to step 3.
Step 3 - Third Duck
From step 1 and 2, current prices need to be below their 60 sma's on each chart. We are now on the 5 min chart and we are looking to sell when price crosses below the 60 sma. For extra confirmation we should let prices break the last low on the 5 min chart. This would mean that prices will be below their 60 sma on all 3 time-frames, therefore all 3 Ducks are lined up in the same direction.
Stop-Losses: This is where you can make this system your own. If you are a short term trader you may want to put your stop-loss above the highs on the 5 min or the 1 hr chart. If you are more of a positional trader you may wish to put your stop-loss above a high on the 4 hr chart. You could also use a fixed stop-loss, maybe 25-30 pips or more from entry. It all depends what type of a trader you are, so you decide! Another "trick" that may help you preserve capital, If you do sell and prices get back above the 5 min 60 sma by 10 pips (not a good sign) you may want to cut your losses short before your stop-loss. But if you are a longer term trader this may not be a big deal for you.
Targets: Same again, depends what type of a trader you are but target can be support or resistance levels.
Summary: The above example was carried out when the gbp/usd was trading lower so obviously we where selling - the system works just as well for buying opportunities, just look for prices to be above the 60 sma on all 3 time-frames, starting with step 1 again. I like this system a lot as it does not try to out-guess the markets movements and pick tops and bottoms. The system will quickly tell you to be a buyer or a seller. Its a good honest system that tries to follow prices. This system works better on currency pairs such as the Eur/Usd and Gbp/Usd, but there is nothing stopping you from plotting this system on any pair, but as we know some pairs act differently to others. The best time I found for trading this system is the European and US sessions. Take care to watch what is going on around you - economic new releases, holidays etc.
Good Luck with the 3 Duck's Trading System.
Captain Currency.
PS: You can view the chart examples for the above on my homepage.thanks for the system, how long u used this system ?
how about performance?
===================
thanks for the system, how long u used this system ?
how about performance?
===================
Forex Indicators CollectionHello Prasxz,
I have been using this "system" for the past few year. I like to call it a guide rather than a system and use it with my own market knowledge and view it as a common sense approach to price observation. Its really impossible to say how much I made using it, because I dont just use this system on it own, but what I can tell you is it has made a difference to my P&l in a positive way. My advice to you would be to demo trade it in the live market across most currency pairs. Make it your own ie stop-loss, enteries, exits, adding to winners etc and see how it works for you.
Kind Regards,
Captain Currency.
A massive big fat wet THANK YOU
Captain Currency, may I just say thank you thank you thank you thank you thank you thank you for posting this indicator.
Being able to see the relationship between different time frames has never been so much easier. I like to use 3 TF yeah, 4hr, 1hr and 15min. And have always had to size my charts up and draw fibs on 3 diff charts so that the other 2 look the same. Now it's all on one chart.
God bless
Captain Currency, may I just say thank you thank you thank you thank you thank you thank you for posting this indicator.
Being able to see the relationship between different time frames has never been so much easier. I like to use 3 TF yeah, 4hr, 1hr and 15min. And have always had to size my charts up and draw fibs on 3 diff charts so that the other 2 look the same. Now it's all on one chart.
God blessHello Spiritbreezer,
WOW, thanks for taking the time to post!
Kind Regards,
Captain Currency
Captain Currency, may I just say thank you thank you thank you thank you thank you thank you for posting this indicator.
Being able to see the relationship between different time frames has never been so much easier. I like to use 3 TF yeah, 4hr, 1hr and 15min. And have always had to size my charts up and draw fibs on 3 diff charts so that the other 2 look the same. Now it's all on one chart.
God blessErrrrrr....It was me that posted the indicator 
Mart
Errrrrr....It was me that posted the indicator
MartHello Mart-Hart,
LOL, Yes all the credit is yours, Im sorry for stealing your thunder! I thought Spiritbreezer was refeerring to The 3 Ducks Trading System.
Kind regards,
Captain Currency.
- Free trading apps
- Over 8,000 signals for copying
- Economic news for exploring financial markets
You agree to website policy and terms of use
The 3 Duck's Trading System
Firstly I would like to say, I did not create or invent this system, I have just added one or two ideas to make it my own and named it "The 3 duck's Trading System" for obvious reasons as you will find out later on. The system is fairly straight forward and easy to use. Like a lot of trading systems it will be more productive when prices are moving in one direction and not stuck in a tight trading range. Of course this system has losing trade and losing runs, but with proper money management and good discipline I'm sure this system will keep you out of bad trades and give you a great chance to make profits in the Fx market. One of the nice things about this system is it will quickly tell you if prices are in an up or down swing phase and stop you from guessing! It will also allow you to decide to be a bull or a bear and trade in the direction of that trend. There are 3 charts involved in this system: a 4hr chart, a 1hr chart and a 5min chart. There is 1 indicator, a 60 period simple moving average (60 sma) plotted on each chart. There you go, its that simple.
How it works:
Step 1 - First Duck
The first thing we need to do is look at our largest time-frame (4hr chart) and see if current prices are above or below the 60 sma. From this chart we can see that current price is below the 60 sma. This tells us that we maybe looking to sell.
Step 2 - Second Duck
The second thing we need to do is drop down to our 1hr chart. We need to see the current price below the 60 sma on this chart also, this gives us confirmation.
Important: If the current price was to be above the 60 sma on this chart we could not move on to step 3.
Step 3 - Third Duck
From step 1 and 2, current prices need to be below their 60 sma's on each chart. We are now on the 5 min chart and we are looking to sell when price crosses below the 60 sma. For extra confirmation we should let prices break the last low on the 5 min chart. This would mean that prices will be below their 60 sma on all 3 time-frames, therefore all 3 Ducks are lined up in the same direction.
Stop-Losses: This is where you can make this system your own. If you are a short term trader you may want to put your stop-loss above the highs on the 5 min or the 1 hr chart. If you are more of a positional trader you may wish to put your stop-loss above a high on the 4 hr chart. You could also use a fixed stop-loss, maybe 25-30 pips or more from entry. It all depends what type of a trader you are, so you decide! Another "trick" that may help you preserve capital, If you do sell and prices get back above the 5 min 60 sma by 10 pips (not a good sign) you may want to cut your losses short before your stop-loss. But if you are a longer term trader this may not be a big deal for you.
Targets: Same again, depends what type of a trader you are but target can be support or resistance levels.
Summary: The above example was carried out when the gbp/usd was trading lower so obviously we where selling - the system works just as well for buying opportunities, just look for prices to be above the 60 sma on all 3 time-frames, starting with step 1 again. I like this system a lot as it does not try to out-guess the markets movements and pick tops and bottoms. The system will quickly tell you to be a buyer or a seller. Its a good honest system that tries to follow prices. This system works better on currency pairs such as the Eur/Usd and Gbp/Usd, but there is nothing stopping you from plotting this system on any pair, but as we know some pairs act differently to others. The best time I found for trading this system is the European and US sessions. Take care to watch what is going on around you - economic new releases, holidays etc.
Good Luck with the 3 Duck's Trading System.
Captain Currency.
PS: You can view the chart examples for the above on my homepage.