Narrow Range Day Indicator - page 2
You are missing trading opportunities:
- Free trading apps
- Over 8,000 signals for copying
- Economic news for exploring financial markets
Registration
Log in
You agree to website policy and terms of use
If you do not have an account, please register
Request to Code Indicator
Hi
Would appreciate it if somebody could code the following indicator. Chart H4. When a bar closes and a new bar opens the indicator should look at the previous bar and do the following: It must look at the high and subract 5pips and look at the low and add 5 pips. It must then display on the chart (upper left corner or upper right corner) the following BUY @ 158.77 and SELL @ 158.52 as an example.
Lets say the previous bar's high was 158.70 it would subtract 5 from that and display BUY @ 158.65 Lets say say the Low was 158.20 it would then add 5 and display SELL @ 158.25
Hope it makes sense
Best rgds and many thanks
Playing yesterday high/low, and day opening ...
Hello all !
After some works on historical datas Eur/USD, i would like to go deeper on
- buying yesterday's high and selling yesterday's low
- buying today's opening + x pips, selling today's opening - x pips
Do these very simpe strategies have names ?
Where to find threads about these ?
All clues very welcomed,
CilO
Hello all !
After some works on historical datas Eur/USD, i would like to go deeper on
- buying yesterday's high and selling yesterday's low
- buying today's opening + x pips, selling today's opening - x pips
Do these very simpe strategies have names ?
Where to find threads about these ?
All clues very welcomed,
CilOThere are many threads about this subject on the forum or close that you easy couldadapt to your needs.
Last started is here: https://www.mql5.com/en/forum/178827
Some Links to start (more inside threads):
https://www.mql5.com/en/forum
https://www.forex-tsd.com/forum/commercial-talks/6254-the-c-o-t-l-system
https://www.mql5.com/en/forum/174154
https://www.mql5.com/en/forum/176055
https://www.mql5.com/en/forum/175751
https://www.mql5.com/en/forum/173522
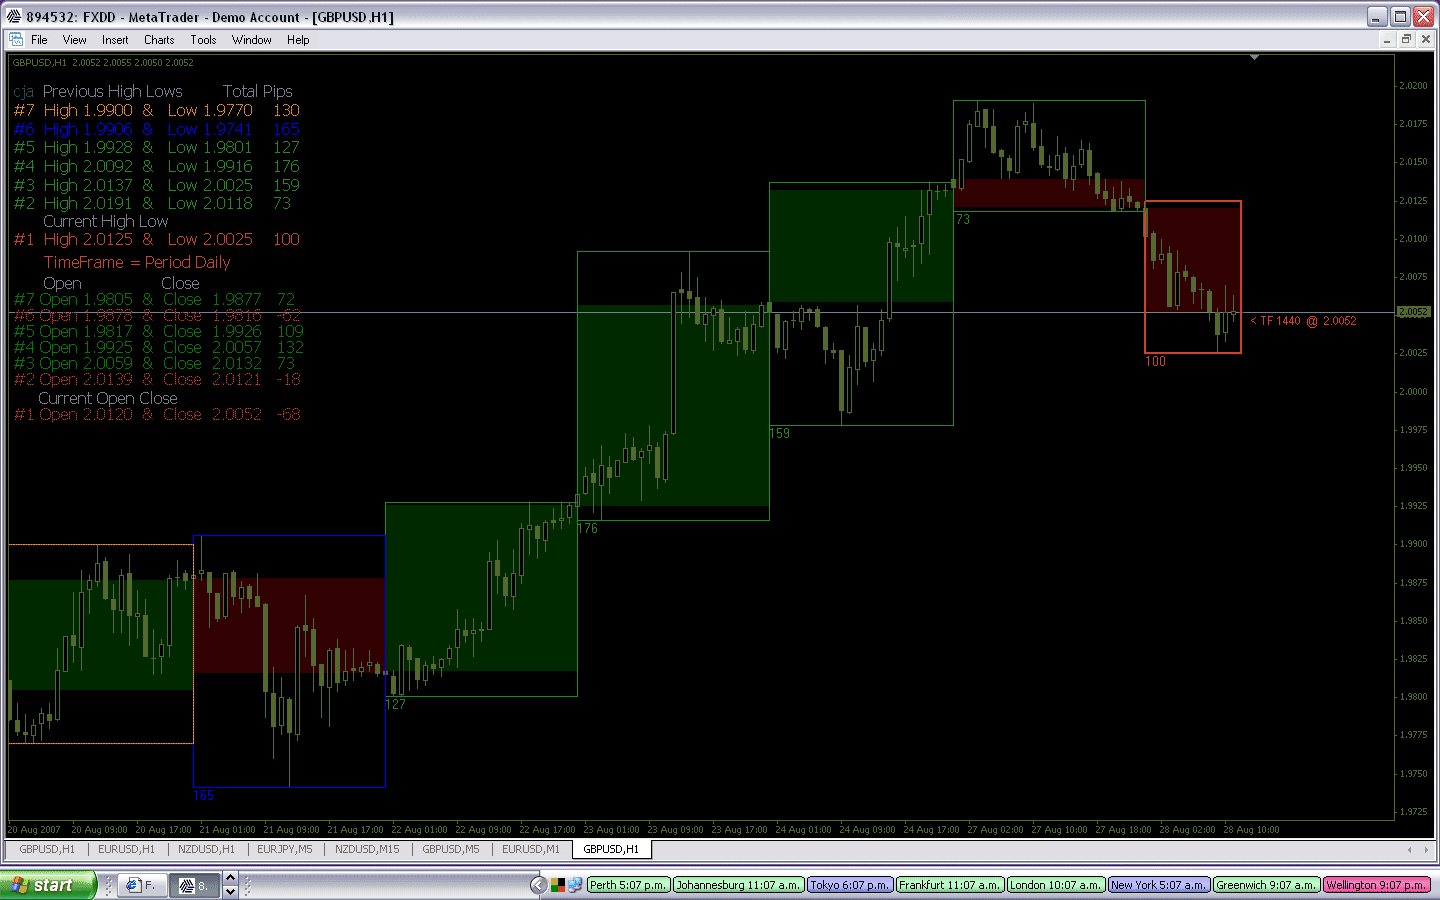
The shaded areas are the Open/Close if the Open is lower than the Close the color is Green and if the Open is higher than the Close the color is Red the outer rectangle is the High and Low for the candle. In short the Shaded areas are the body of a normal candle and the outer rectangle represents the wicks, if you go into the inputs you will find you can bring up the "Legend" which will tell you what the other colors mean, you can also enlarge or reduce the text to suit your needs or remove it entirely. Enjoy. cja
I'm confused a bit.
Is it lagging or leading?
I think will do what you want i originally made this indicator to show inside outside candles however if you set it to Daily (1440) it will show the last 7 Daily Candles and gives the number of pips each has moved so it is pretty easy to see which day has the most narrow range.
_hi_low_-_open_close_candles.ex4Hello cja;
Would you please modify making the line " < TF 1440 @ 2.0052 " larger or heavier so there will be easier to read.
There will be great benefit allowing user to resize them.
Anyhow thank you for your kind help.
Adding more days
Could you please add an option to change for more candles to show, more days than 7 or like a month or more
thank you for your time
I think will do what you want i originally made this indicator to show inside outside candles however if you set it to Daily (1440) it will show the last 7 Daily Candles and gives the number of pips each has moved so it is pretty easy to see which day has the most narrow range.

_hi_low_-_open_close_candles.ex4could any one give me daily range indicator plz.
hi folks
i wish if any one have an indicator mesaure the daily range for last 22 day trading and write the range for every day of them on the chart
and calaulate the average of rage for the last 22 day
could any one help me to find this indicator plz,
Price_Range.mq4 _https://www.mql5.com/ru/code/8808
Looking for current bar indicator
Hi all, I am looking for current bar indicator that calculates number of pips from high to low with more history. I have not been able to find.
works well
I think will do what you want i originally made this indicator to show inside outside candles however if you set it to Daily (1440) it will show the last 7 Daily Candles and gives the number of pips each has moved so it is pretty easy to see which day has the most narrow range.

_hi_low_-_open_close_candles.ex4Thanks CJA....this one works fine but is it possible to get a little more history? Say 30 or 60 days back?