3layerRBY Trading
very nice setup ....mind to share the template and also the indi.. and explaination how to trade with the setup
thanks in advance

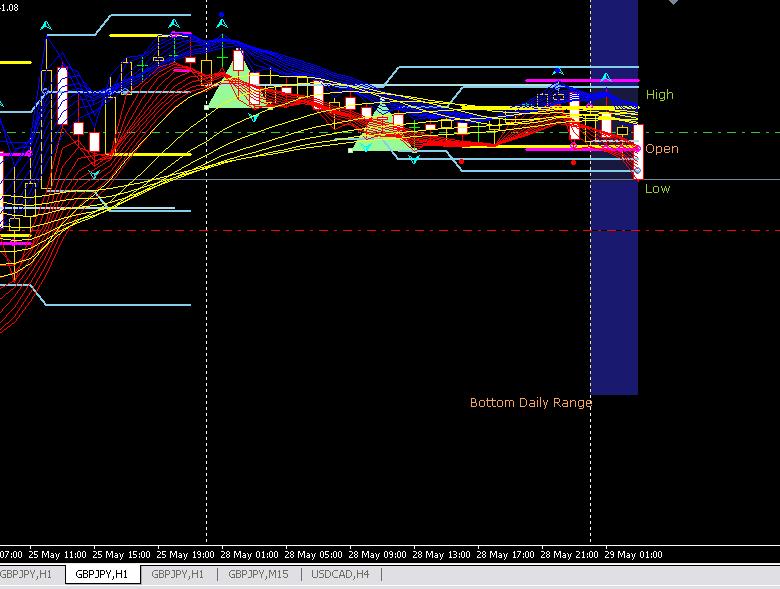
Yesterday analysis 28th May..even pair g/j is not big move but if follow the strategy > sell when bear candle/red layer enter the yellow area at least 25pips in our hand..
Yesterday wave for pair g/j is downtrend > we can see clearly from both layer red & blue, maybe today also down trend since the yellow layer start above the price..
Anybody use this strategy....
Nic
I was watching my trade with it this morning, but I didnt use it to enter the trade.
Looks like it might help.
Yesterday analysis 28th May..even pair g/j is not big move but if follow the strategy > sell when bear candle/red layer enter the yellow area at least 25pips in our hand.. Yesterday wave for pair g/j is downtrend > we can see clearly from both layer red & blue, maybe today also down trend since the yellow layer start above the price..
Thank you very much for sharing.
1. The blue shaded area on my platform is not on today,s price data
but rather showing yesterday's range. Any advise?
2. Any advice on SL and TP? or is it only on system?
3. What is your favorable pair using this system?
4. What are the the roles of SDX and fractals?
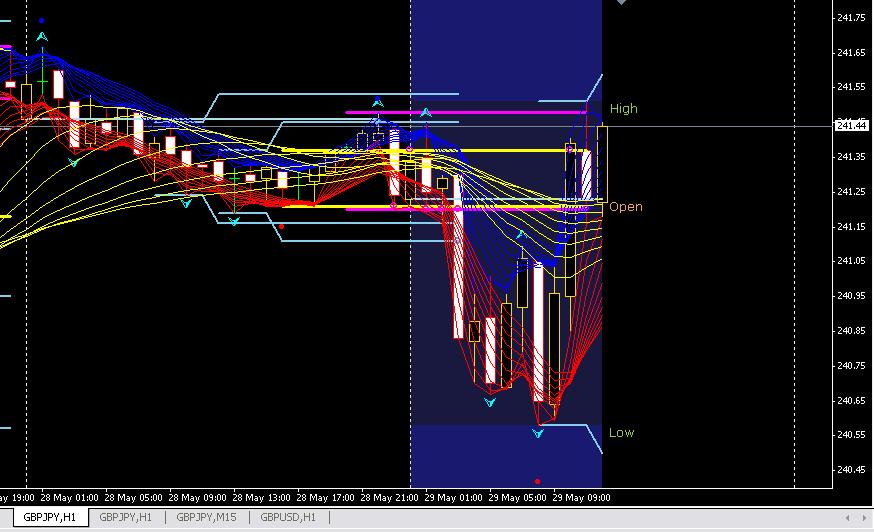
Look at today 29th May trend for pair G/J...
In this morning (I'm in GMT 8) we can see that trend is down because yellow area above the price and I also was short my position and already got 50pips.
Why I confident it will downtrend in this morning because from yesterday 28th May price/bear candle already enter the yellow area even it try to breakout yesterday upper SDX but fractal was appear and give the downtrend wave.
But in the afternoon (GMT8) market was reverse back and we can see the below fractal was appeared and bull candle strongly enter back to yellow area to give buy signal.
Hope this will help to understand my above explanation why I'm using SDX and fractals.
Thank you very much for sharing.
1. The blue shaded area on my platform is not on today,s price data
but rather showing yesterday's range. Any advise?
2. Any advice on SL and TP? or is it only on system?
3. What is your favorable pair using this system?
4. What are the the roles of SDX and fractals?I focus on pair G/J and daily target at least 40pips. If you always on monitor you can get more than that depend on movement this pair.
SL depend on your own MM (money management) but don't too small like 10-20pips because it does't work if market price have the big zigzag before it follow the trend. If SL too small even your direction is true maybe the price will touch it.
Fractals will appear when market oppose my directiom for example if I on (sell position) when below fractal appear it will alert me maybe market will reverse but always follow the trend before close that position because sometimes market back in previous trend so we can take more pips from that.If market really reverse we can see that bull candle appear strongly and enter the yellow area so we must close quickly our position.
I use SDX also to see the trend. If market can breakout yesterday upper SDX (yellow or aqua) trend maybe bullish
If market can breakout yesterday lower SDX (yellow or aqua) trend maybe bearish..
Try to see the history you can get what I mean..
Thank you very much for sharing.
1. The blue shaded area on my platform is not on today,s price data
but rather showing yesterday's range. Any advise?
Maybe you are using different broker with different time from my broker. That why the blue shaded is not suit in your platform. Never mind blue shaded is not important because it only indicates high, low & daily range. If you want you can download from T-S-R indicator to meet your platform.
buy > if the bull candle/blue layer start to enter yellow area from below
sell > if the bear candle/red layer start to enter yellow area from above
blue layer indicate wave on highest candle
red layer indicate wave on lowest candle, so we can see the trend from both layers
uptrend > when yellow layer below the price/support the price
downtrend > when yellow layer above the price/resist the price
I believe, there are 2 more indicators that are required. the first is (T_S_R)-Daily Range Display#2.ex4 and the second one is SHI_SilverTrendSig.ex4
By the way, thanks onetarmizi for sharing...
- Free trading apps
- Over 8,000 signals for copying
- Economic news for exploring financial markets
You agree to website policy and terms of use
I have a technique here to trade and see the trend of market.
Here is my sample technique..I will reply if anyone would like to know.
Regards,
-onetarmizi-
Latest version: refer here