Aleksandr,
Looking at your system, what stands out most to me is something you might want to take a look at:
Your indicators are all doing the same thing. They're telling us a trend is in place. Not one is telling us anything different. For a 4hr chart, your stochs/momentum do not need to be longer than say 8 ish for stochs and perhaps 14 ish for momentum.
Let the moving averages tell you the trend and your oscillators warn you of overbought and oversold and/or trend arousal and exhaustion areas.
Good luck.
Thx PipTrip!
I've just found out one nice indicator for exits, thx to Igorad.
Tunel system ea need!!!!
Hi everyone!!!
I am beginner in MT4 and we tested the demo an interesting method and please help me to make a EA.
My method is the tunnel and make trade orders in a tunnel by “n” pips (variable).
The rules are:
+BUY+
level1:buy say 0.1 lot TP and SL
level2: sel 0.2 lot buy price –pips and reverse TP, SL
level3: buy 0.4lot at price first buy and TP, SL idem
level4: sel 0.8 lot at price sell and TP, SL idem
……etc.
or other method……………………………
---level1:buy say 0.1 lot TP, SL and make pending order (sel 0.2 lot buy price –pips nd reverse TP, SL)
--- when take the next sel 0.2 lot , make pending order (buy 0.4 lot at price forst buy and TP, SL idem)
---when take the next buy, make pending order (sel 0.8 lot at price forst sell and TP, SL idem)
…..etc……… up to MaxTrades
The method does not lose all your money if you fail because freemargin not allow more trade or was reached to MaxTrade.
Similar for +SELL+
some variable to the EA:
TakeProfit=; // Profit Goal for the latest order opened
StopLoss=; // StopLoss
TrailingStop=; // Pips to trail the StopLoss
MaxTrades=; // Maximum number of orders to open
Pips=18; // Distance in Pips from one order to another
MagicNumber=222777; // Magic number for the orders placed
Money Management";
Lots=0.1; // We start with this lots number
Multiplier1=1.5;
Multiplier2=2;
AccountisNormal=0; // Zero if account is not mini/micro
SecureProfit=10; // If profit made is bigger than SecureProfit we close the orders
AccountProtection=1; // If one the account protection will be enabled, 0 is disabled
OrderstoProtect=3;
(variable is similar TERMINATOR v2.0 EA)
I apologize for my bad English.
Thank you
Anyone still using this setup?demo or live
 Just say Hello
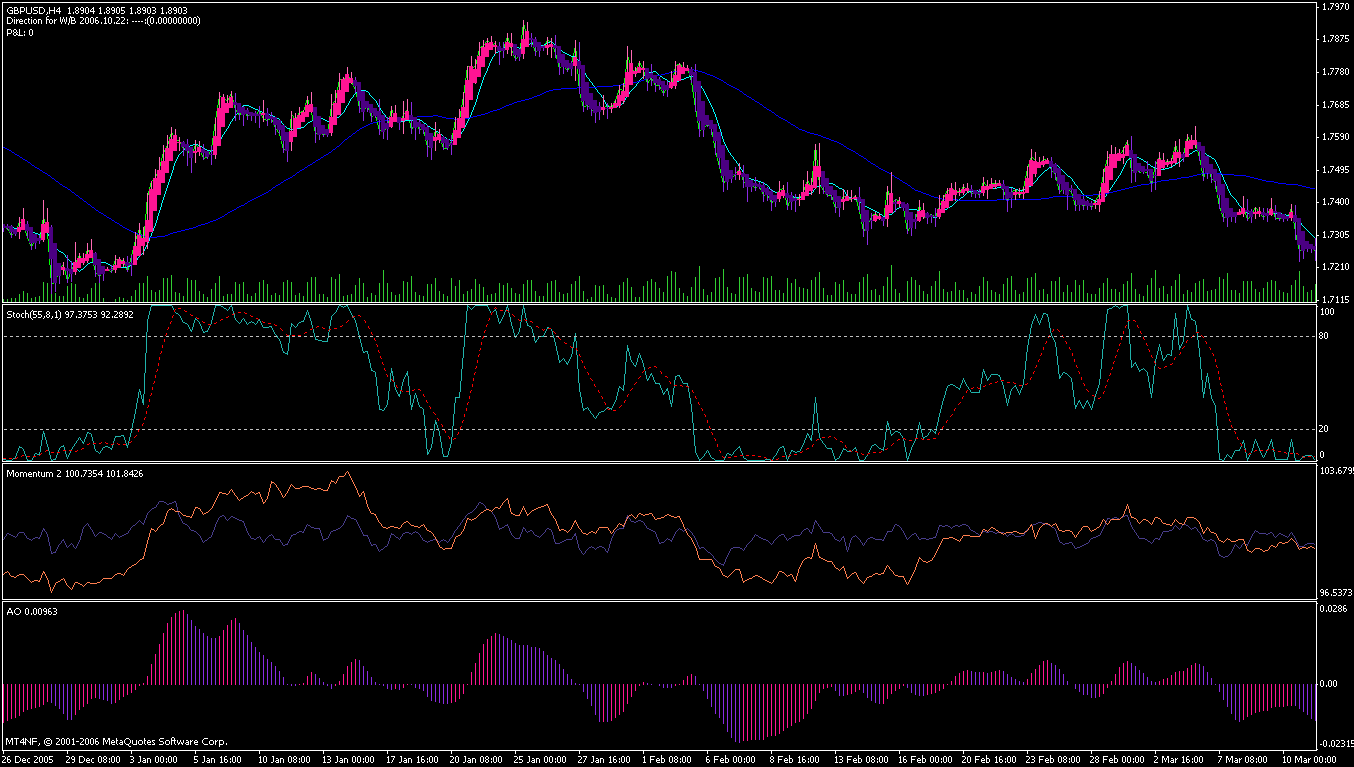
and this is to illustrate how reliably stochastic gives the enter/exit trade signals
and this is to illustrate how reliably stochastic gives the enter/exit trade signals

btw, here's my Momentum2 indicator and Vegas4H indicator that I found somewhere in this forum, all in the attachement.
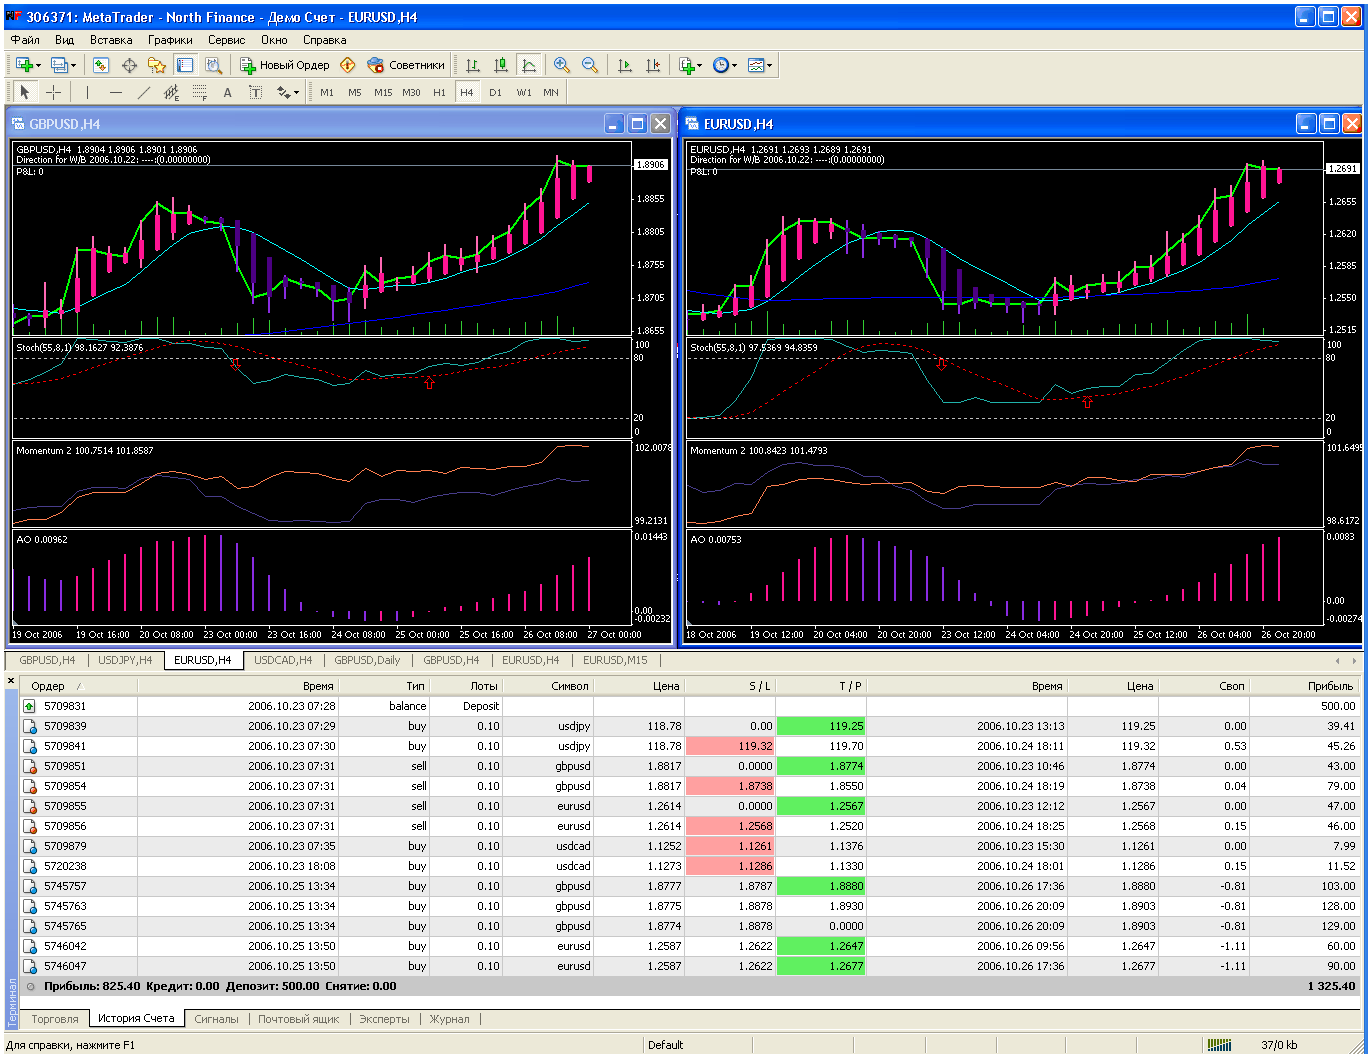
and the result of using this system for this week (it was a very well-trending week though, I suppose it's an ideal case).

Aleksandr,
Looking at your system, what stands out most to me is something you might want to take a look at:
Your indicators are all doing the same thing. They're telling us a trend is in place. Not one is telling us anything different. For a 4hr chart, your stochs/momentum do not need to be longer than say 8 ish for stochs and perhaps 14 ish for momentum.
Let the moving averages tell you the trend and your oscillators warn you of overbought and oversold and/or trend arousal and exhaustion areas.
Good luck.About the use of the stochastic indicator, for showing overbought and oversold areas (and the use of indicators in general, by the way), just take a look at historical data and notice how the stochastics move in and out these presumed OB and OS areas all the time, thereby leaving it up to you to guess how far price will retrace (this 'up and down' behavior of the stochs happens even when price hardly moves at all!). Trading is all about 'guessing', although there are 'higher probability' moments for getting into the markets and try your luck - there is indeed a higher probability for success when you open a trade in the direction of the main trend (as indicated by moving averages, which use 'statistical data', which is old data, but even so called 'pure price action' cannot do anything else to try to predict 'future events', no matter how hard they wanna deny that fact).
What makes it so hard to gain money in forex is not finding the right moment to open a trade, but to stay out of the hands of the 'forces that move the markets'; or don't you think it's strange that traders would start selling or buying at some point, after which other traders come in and start to make opposite 'bets'? I could understand that this happens now and then (when a big business has no time to wait for a better deal on the currency they immediately need to get their hands on, in order to pay whoever for whatever reason in a hurry - although, one would think that 'big business' works more organized than that), but it happens all the time... If it's not you and me that are causing price to spike up and down (as if it COULD be you and me), especially at 'critical points' - where all of us are gathered together, glimpsing at our indicators and preparing to pull the trigger as soon as price breaks support/resistance, 'Big Numbers', Fibs, or whatever. Don't be fooled: 'Big Money' knows exactly what you're doing and where you are on the charts, so all they have to do is trigger as many trades as possible, even repeat their actions a few times, 'till there's enough small fish in their nets to start pulling them in...
Lesson to learn is to, whatever else you do, never allow yourself to lose more then 1-2% of your account on any single trade. Also, don't jump in there like a headless chicken, but let price first do it's thing - watch the flock getting trapped and realize that could be you and more than likely has been you for the last, shorter or longer, past period - and only consider opening a trade when price retraces back to its 'entry point' and bounces off of it, i.e. a new candle opens in the original direction, after the bounce.
I'm not a star trader (yet), but hope that my obscure experiences and observations in this sea full of sharks (what we call 'Forex'), prove helpful to those just starting out on this great adventure that trying to make your own way in this life ultimately is.
By the way, a great alternative for this Vegas Tunnel Method is to be found here. Actually, it's based on the same priciples and it's also free (and it's still one of the few I keep going back to, because I know it's profitable, if only I was too... yet :-)
Edit: I'm using H8 charts to follow up on how 'mature' any signal on the H4 charts already is (D1 charts feel too far out for the purpose of confirmation; it's a personal tweak, so try it out for yourself first, like anything else you come across in life - please, also apply this advice to any action you want/need to take involving the 'health industry' the money sharks don't limit their playground to the foreign exchange markets...). For generating H8 charts, you can use the attached indicator, just put it in the custom indicator map of your MT4 platform, put it on a H4 chart and by default it will generate a H8 'offline chart', which you then can open and apply your H4-template to (with the period converter indicator removed from) from the 'File'-'Open Offline' menu.
Cheers guys and girls :-)
"[...] It had one problem though, it lacked real psychologically-reliable signals to work with, I just can't force myself to wait for 300+ pips (in the description files guys from vegas team give high fibs, but often we have chops for +/- 100 pips, which is really psychologically frustrative).[...]"
I'll attach these for-mentioned 'description files' (well, I only came across one such file, a document from 'Vegas' himself, or at least that's what seems to be the case, when you read it's content), which I've converted to the more user friendly PDF format. In it, Vegas states the following, regarding the use of lower and higher time frames than the H1:
"Why 1 hour charts?
Smaller charting periods lead to more false positives, which translates into more losses.
By the time you get to the five minute chart, the bank has you on a string and your
account is going to go to them. Longer term charts, like daily and weekly produce to
much slippage in market price for the final portions of the position. In the fall of 2004,
when GBP/USD went 20 handles up to 1.95, the daily EMA's were 5 to 7 handles behind.
For me, this is too much to give back on a long position, especially when your first
profits came at 55, and 89.
2 hour and 4 hour charts are roughly analogous, but I prefer the 1 hour chart for its
simplicity, and sometimes it's tough to see how a market trades in a 4 hour period."
If you wanna get first hand information about the Vegas Tunnel Method, just read what the originator himself has to say about it, before you start tweaking it (something Vegas doesn't seem to object to at all, by the way - my gut feeling tells me that he's the kind of guy who finds pleasure in attributing to the happiness of others).
Cheers
- Free trading apps
- Over 8,000 signals for copying
- Economic news for exploring financial markets
You agree to website policy and terms of use
HI ALL!
Guys, when I saw 4h tunnel here on forum I was amazed this summer. I Plot it on the chart and it's just perfect on history.
It had one problem though, it lacked real psychologically-reliable signals to work with, I just can't force myself to wait for 300+ pips (in the description files guys from vegas team give high fibs, but often we have chops for +/- 100 pips, which is really psychologically frustrative). I have tried to solve this by problem by introducing extra indicators of my own,
which is the Momentum2 indicator, it's just 2 momentums for the same periods as in MA, 55 and 8.
(it basically tells us when the trend is about to change - when momentum channel becomes narrow, but it's a really really lagging indicator!)
Also I've put there stochastic with same periods. It shows enter and exit signals just perfectly, they seem to be safe about the 80 and 20 dashed lines.
And I've put there Williams' OA, to show the direction of trend power, it's good for exit signals (when the new bar changes color we exit).
And finally I've colored the trend bars on the main chart with Heiken Ashi.
So guys, now I'm in search for a perfect money management system for this model.. MM method for short term trading (one change of color in Heiken Ashi) and for LOW BUDGET. I would be grateful so much for any suggestions on that.
Maybe someone would like to code an automated trading script out of that material? What I strongly believe, there can be made a very well automated trading system with this kind of heuristics described above (signals of momentum2 narowness, stoch, OA etc) using some Fuzzy Logic algorithms and some open source FUZZY LOGIC library like that one http://ffll.sourceforge.net/ The lib is quite simple to use, but unfotunately I'm not 1331 enough in the algorithmic part of such things