Using RVI to filter/entry tops and bottoms
wow great tool ! i hope any coding expert will look into this. nice job 
please explain
1st class quality signals ("bright" arrows on the attached chart) are obtained when RVI 13 crosses with its signal, and when RVI 13+13 is at the same side of the 0-line,
 with the RVI 13+13 crossed in a convergent way.
FxSamurai,
Please explain the quoted paragraph.
What is a better way to describe
"crossed in a convergent way" ?
Thank you
Hope someone will make the change for you, I know there are some great coders here....
hi! I think I can modify it, but a bit later when I have time. I'm quite interested in that, cause I need a good reversal indicator for my system here https://www.mql5.com/en/forum/175380
the problem is that it's for 4h frame, can u suggest some nice values for it to be working on 4H?
man, thx again for your post!
you just gave me answer for my very question this night... so fast 
hi
good indicators, just one signal alert additional can make it complete i guess..
============
Rvi
My RVI indicators just have the 2 lines but not the histogram...Is it the histogram we are looking to be on the same side of the zero line?
Where can I get the histogram?
Hi guys,
Needed some time to do some further back and forward testing with this indicator, and to make things more reliable.
While RVI is a pretty interesting indicator, for the moment I tend not to use it as a trigger for entering a trade, but mainly use it for confirmation.
The signal I described in my first post, as such, is not as reliable as it seemed. I've been trying to find more reliable signals.
I've tried to filter the signal adding RVIs with other settings, and this does help, and also offers extra possible signals.
See the attached charts for an example of the settings I'm using.
In order to avoid being trapped by a rally like the one of the EUR/USD last week, one possible filter is to only accept signals on the RVI 13 and 13+13 when there is divergence on the RVI 8, with RVI 8 crossings showing two divergent "bumps". See the first attachment for 2 examples, of which one nevertheless gave a failed signal, but which allowed a safe stop at +1 pip.
It happens that neither of the signals I described in my first post can be found in time, at the beginning of a significant reversal. In order to benefit from a maximum number of opportunities, it is necessary to also look for signals on the timeframe below the one you choose to take your main signals from.
However, extra signals are also offered by RVI 5. One very useful signal is when RVI 13 and RVI 13+13 are on opposite sides of 0, and when RVI 13 and signal are above/below +0.1/-0.1, with at least RVI 13+13 or its signal below/above -0.1/+0.1.
When RVI 5 crosses with its signal, pointing towards the 0 line, the price will go as indicated by RVI 8 and its signal. When RVI 8 and signal are above/below 0 (and prefereably above/below +0.1/-0.1), then the price will move downwards/upwards (sometimes after some retracement). See the second attachment for some examples (see 2nd and 3rd signal on that chart).
It may seem a bit awkward to find these signals, but once you understand the idea, it will be easy to spot them. It generally gives signals for relatively small reversals, but sometimes it's the only useful signal for a major reversal. It can generally be useful for taking profit or to spot unexpected short reversals before planned entries.
Note that when RVI 8 and signal are between +0.1 and -0.1, then the signal may be weak and unreliable.
Another important note: when RVI 13 and its signal, and RVI 13+13 and its signal are all at the same side of 0, and at the same side as RVI 5, then don't take signals on RVI 5, but only on RVI 13, like described earlier (see 4th signal on attached chart, which is false).
When RVI 13 and its signal, and RVI 13+13 and its signal are all at the opposite side of 0 than RVI 5 and its signal, then this is a pretty good signal, indicating that price will move in the direction as indicated by RVI 13. Then when RVI 13 and signal are above/below 0, the price will move downwards/upwards. (see 1st signal on chart).
Have fun with it. I'm interested to hear what people's experiences are with this, and if anyone finds useful filters and/or other signals 
FxSamurai,
Please explain the quoted paragraph.
What is a better way to describe
"crossed in a convergent way" ?
Convergent is like this: // , i.e. moving in the same direction.
Divergent is: \ / , i.e. moving in opposite directions.
Also see the first attached chart.
My RVI indicators just have the 2 lines but not the histogram...Is it the histogram we are looking to be on the same side of the zero line? Where can I get the histogram?
The histogram is found on the version in the Intellichart software. The MT version has no histogram.
Take care 
Hi,Please show me entry and exit rules .
Thanks all
- Free trading apps
- Over 8,000 signals for copying
- Economic news for exploring financial markets
You agree to website policy and terms of use
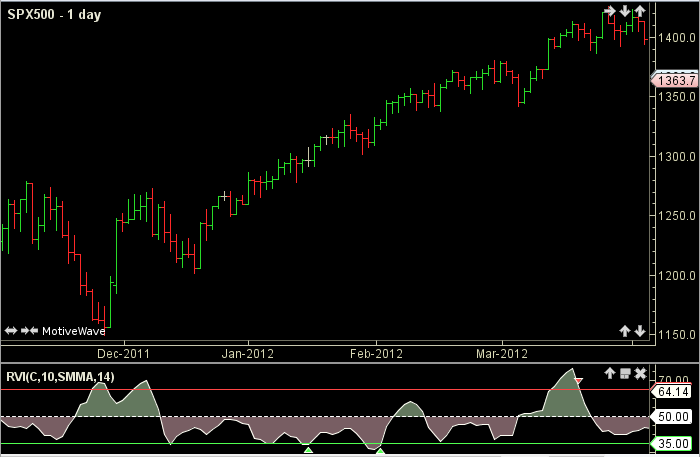
The RVI indicator ( Relative Vigor Index ) is a pretty good indicator which can be used in various ways to identify reversals.
I developed a way to use it for making absolute fool-proof extremely safe and reliable entries, at the beginning of very significant trend direction changes. It can work as a stand-alone system or as a filter. See the attached image for an example.
Here is how it works.
Take a RVI 13 and a RVI 13 that is displaced 13 candles to the right (RVI 13+13).
1st class quality signals ("bright" arrows on the attached chart) are obtained when RVI 13 crosses with its signal, and when RVI 13+13 is at the same side of the 0-line, with the RVI 13+13 crossed in a convergent way.
A very safe stop-loss can be placed right at the maximum/minimum of the preceding significant reversal (or fractal).
This signal is very safe and very reliable, and can be used as a stand-alone system, or to filter entries at tops and bottoms.
2nd class signals, and often false, but sometimes nevertheless useful ("dark" arrows on the attached chart) , are obtained when the RVI 13 crosses towards the zero line, while RVI 13+13 is on the opposite side. This often indicates a continuation of the trend in the opposite way of how RVI 13 is crossing. This signal should only be used with other indicators.
The RVI indicator is one of the default indicators of the Metatrader software (see "Oscillators"). However, it doesn't have the possibility to be displaced, which is why the attached chart was generated with the Intellichart software.
It would be great if someone could modify the MT indicator so that it can be displaced, i.e. "shifted". An example of an MT indicator that can be shifted is the Moving Average indicator.
The mq4 file of it can be found at https://www.mql5.com/en/forum/175345
Enjoy!