Color Coded AMA?
none of the programmers in this forum wanna take a shot at it?? i truly believe it can be a powerfull tool.
regards
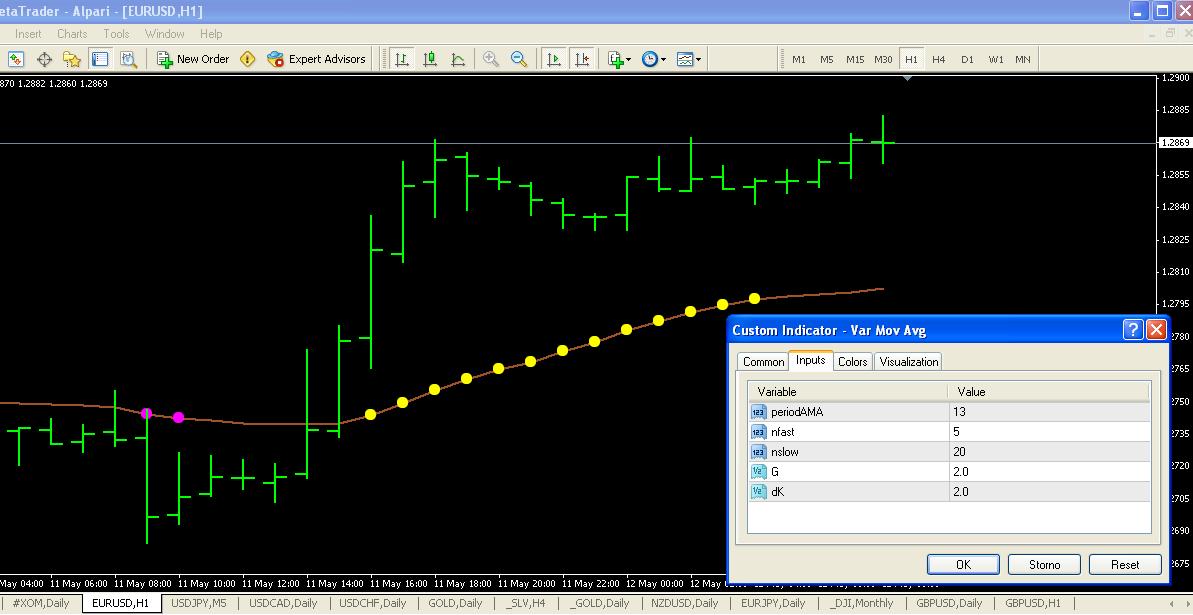
ok..i tried making AMA color coded but as you can see in this indcator....i am not able to acheive it. there are gaps and sometimes the color changes...when it should not. 
regards
wonderful
it is wondeful indicator
i would like help you
i have interest result for you
Hi gang,
can someone build a color coded AMA indicator? it could be blue when it is trending up and red when trending down. i tried doing it..but couldn't get around it. i think if done this way...it can be a powerfull indicator. thanks
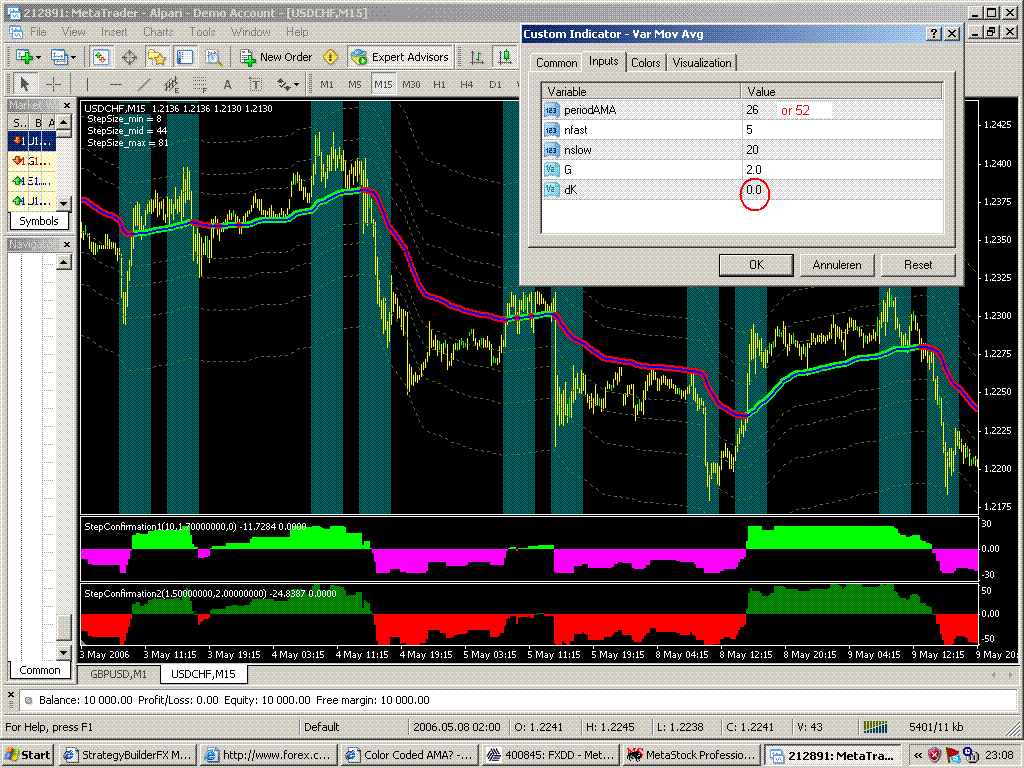
regardsThe AMA or variable moving average is indeed a great indicator. I use it now severall years for my professional trading.
I could sujest the following: place the dk value on 0 (as shown on image). This way you will get plenty of dots and they will give you the impression what you are looking for.
I can also sujest the values that you see on the image. Lots of backtest (over many years of data and severall pairs and stock indexes) with Metastock professional proved that those are the best values.
Hopefully this can help you a bit....
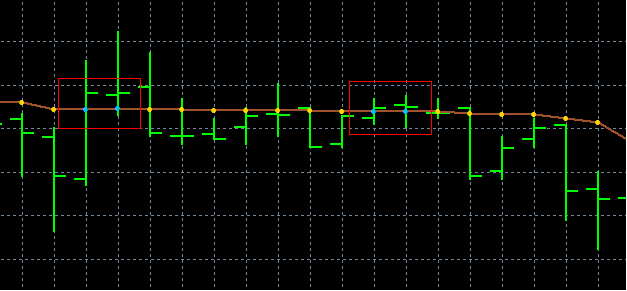
Thanks Igor....your suggestion has really been helpfull. it now does show the dots right. but there are still some issues. as you can see the picture i am attaching.....these 2 instances the AMA did not change its slope..instead became flat...but the dots changed. the dots changed because i guess the close was higher than the AMA. can you tell me how can i do it...so the dots only change color when the slope of the AMA changes..and when it becomes flat..it should remain the same color as the previous dots. thanks.
Hi Forexboss...have you been able to achieve something? thanks
regards
The AMA or variable moving average is indeed a great indicator. I use it now severall years for my professional trading.
I could sujest the following: place the dk value on 0 (as shown on image). This way you will get plenty of dots and they will give you the impression what you are looking for.
I can also sujest the values that you see on the image. Lots of backtest (over many years of data and severall pairs and stock indexes) with Metastock professional proved that those are the best values.
Hopefully this can help you a bit....Hi iGoR..
Could you please share yours indicators???
Thank you
Thanks Igor....your suggestion has really been helpfull. it now does show the dots right. but there are still some issues. as you can see the picture i am attaching.....these 2 instances the AMA did not change its slope..instead became flat...but the dots changed. the dots changed because i guess the close was higher than the AMA. can you tell me how can i do it...so the dots only change color when the slope of the AMA changes..and when it becomes flat..it should remain the same color as the previous dots. thanks.
Hi Forexboss...have you been able to achieve something? thanks
regardsHi Gabroo_munda,
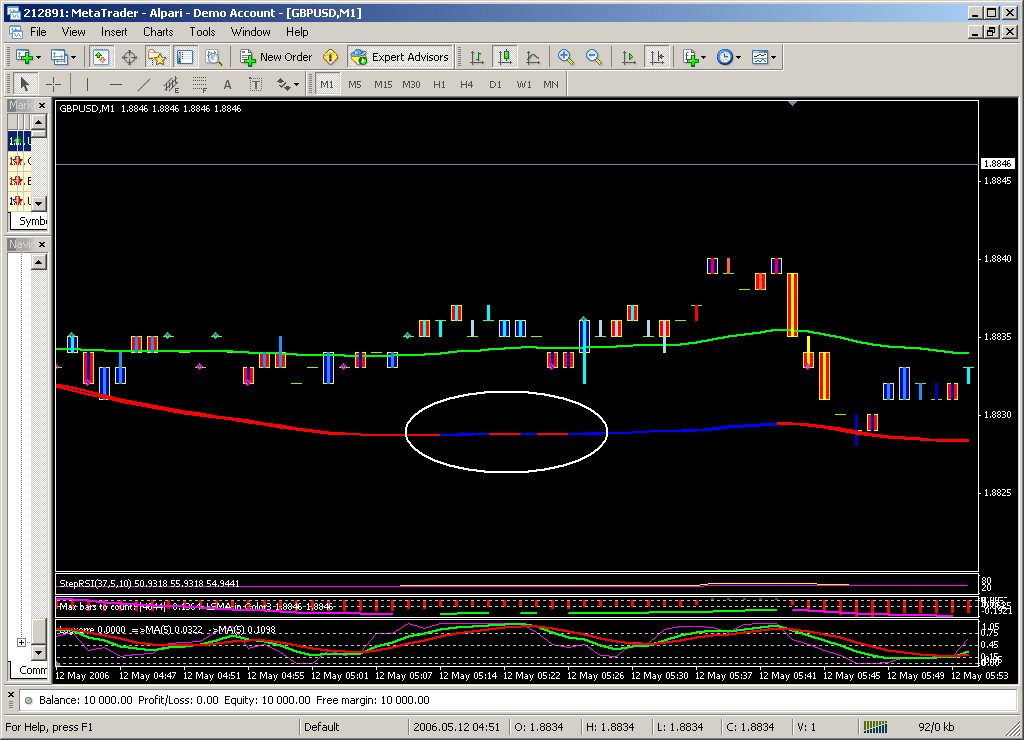
What apears to be flat to the naked eye doesn't mean that matematicly it is flat. On the image I placed triggerlines. They change color when the slope of the triggerlines changes. The indicator seems flat to the naked eye (white elips) but matematicly it reacts on the smallest price change.
So if you would find someone who can color the slope of the AMA indicator it will exactly do the same as were you see the dots change color.
The AMA indicator has the great capacity to stay flat in some market conditions. Meaning that when price stayes flat or horizontal the AMA doesn't want move towards the price were other MA's are moving back to the price. If that sideways period takes to long, every other MA and price will meet and will cause a lot a false crossings to happen. But the AMA doesn't do that it stays on a certain level and stays horizontal. But as I said, that horizontal to the naked eye is not the same as been perfectly horizontal in real matematic values. The smallest movement of price will have a very small impact on the value of every kind of MA even the AMA...
friendly regards...iGoR
Hi iGoR..
Could you please share yours indicators???
Thank youHi Hellkas,
Indicators template and strategy and chat room (were trades are monitored all day long) are explained in this topic
http://www.strategybuilderfx.com/forums/showthread.php?t=16299
friendly regards...iGoR
PS. Indicators and template are to be found in posting # 2. There are 2 differant templates, 1 for the major 3 pairs and 1 for the JPY pairs.
it is my questions
when we have this parametres....Signal change colour during bar?
i think that signal stay same because it give signal only sometimes with this paramatres
yours opinion?
- Free trading apps
- Over 8,000 signals for copying
- Economic news for exploring financial markets
You agree to website policy and terms of use
Hi gang,
can someone build a color coded AMA indicator? it could be blue when it is trending up and red when trending down. i tried doing it..but couldn't get around it. i think if done this way...it can be a powerfull indicator. thanks
regards