Super Signals Indicator - page 32
You are missing trading opportunities:
- Free trading apps
- Over 8,000 signals for copying
- Economic news for exploring financial markets
Registration
Log in
You agree to website policy and terms of use
If you do not have an account, please register
Thanks
Hi all.
As any indicator the super signal will "fail" or repaint. But if you know how to use any indicator in conjunction with PA which is the king you will have great success.
Any indicator FIBS, EMA, S/D zones, daily pivots, Murrey Math lines they all are showing us A POSSIBLE turning point.
But the truth of using successfully these indicators is somewhere else.
Try to teach your eyes and brains to recognize the turning point in a trend in what ever magnitude, 5 min 15 4h and etc.by reading the tape not the indicators.
First tip from me.
Use the super signal just on 4H and again take it as possible high or low. One thing that you can do to increase your odds of trading successfully this signal, is after 4H super signal appeared the next 4H candle would close under or above the high and the low of the signal candle. If you just have a look at 4H candles you will recognize that 4H swings are very much telling the story in nice swing it is very seldom to have one or two candles that went against the current swing and to reverse again and continue the initial move.Of course the market can surprise, but for this there are some filters that I will share with you latter if there is enough public.
You just need to listen and read the market. At the time of this writing I am currently up 60 pips on the euro/usd and moved my Sl at break even.
Also, always take the signals that are with the prevailing trend on higher time frame. As MACD can be in divergence for very long time or stochs. can stay overbought or oversold for long time in strong down or uptrend, the same thing will happen with the super signal,as we all know in down trend for example stochs will be more accurate when showing overbought, the same thing goes for the super signal.
Super signal is not the holy grail. The holy grail is you!!!!!!!!!!!!
greetingsHektorian,
Thank you very much for sharing!! Great info!! If you have any other hints on confirming Supersignal, we would be very interested to hear. Thanks again!!
Theo Boyd
New way to use super signal
Hellomladen
is this possible to make auto trend line from super signal indicator?????
i tried to explain thru image
ThanX in ADV
pbb,
Try this version (it is abit different than your idea, I did it so because for short periods you would risk cluttering the chart with lines)
It keeps repeating the last fractal till the new one in the same direction is formed, and that way it bcomes a sort of a line. If you wish to draw it at exactly highs and lows set the UpperArrowDisplacement and LowerArrowDisplacement to 0 and then they will match exactly the high and the low at which they were formed
Arrows appear/disappear
Hello, I have tries this arrow indicator, not sure if too many times arrow disappear...can you let me know...
John
Hello!
I found this indicator. It gives decent signals. Sometimes the arrow signal is not visible becaue of the way the code causes the arrow to be placed a certain distance from price bar. I would like to move the arrow it creates closer to price so it is not off the chart. I do not know how to change this indicator to do that. Perhaps someone would be willing to modify it to be more useful this way.
I like to compare this indicator to ADXcross. It signals less often so not as choppy, and earlier than ADXcross. I must watch to see if it disappears and repositions its placement.
Thank you.
~Nebula....
Try out this version
It is drawing 2 pairs of trend lines : completed (from previous 2 fractal values) and current (from last 2 fractal values) Prices used for it are highs and lows. You can put multiple indicators on the same chart as long as the UniqueID is unique for each instance you attach to the chart
Hellomladen
is this possible to make auto trend line from super signal indicator?????
i tried to explain thru image
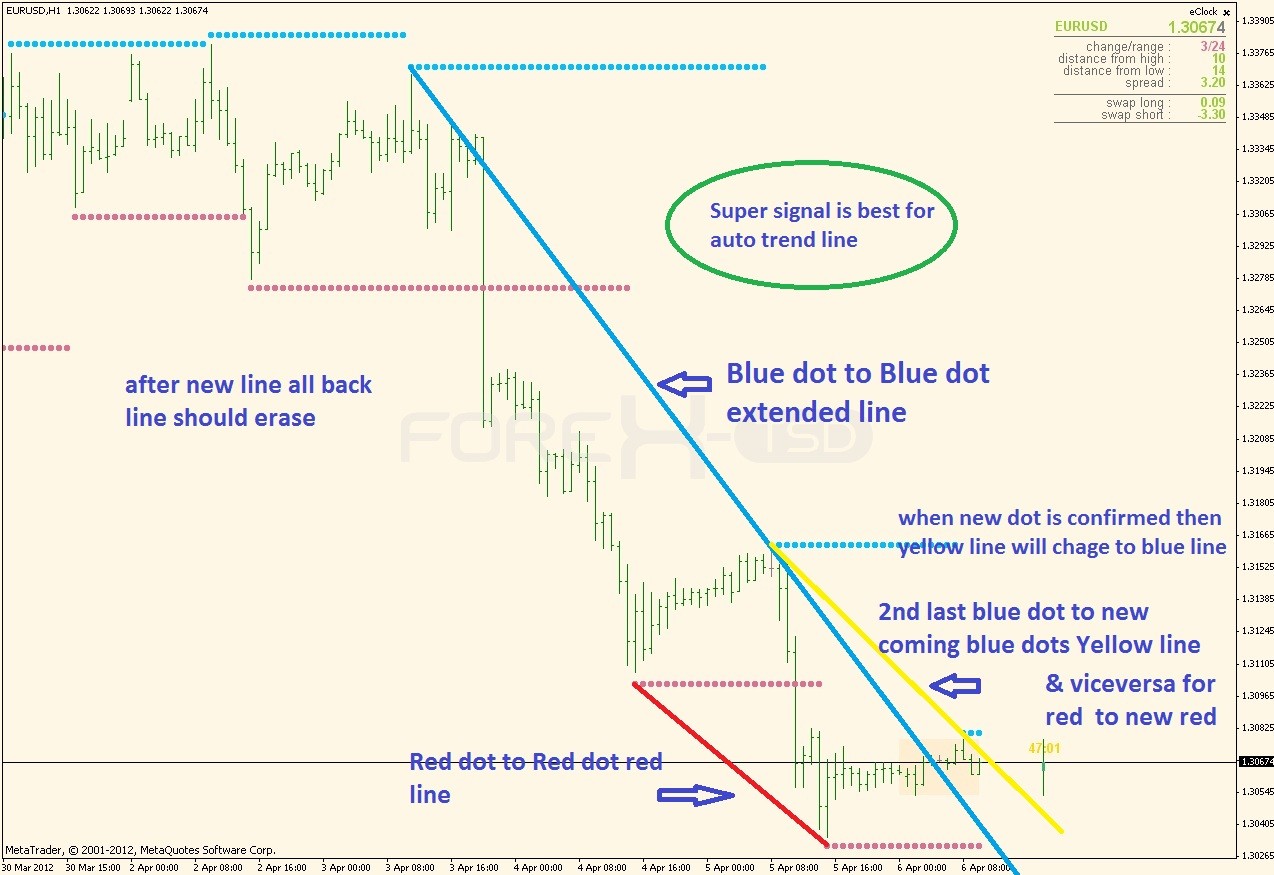
ThanX in ADVdownload the indicator (auto) on page 32 , thanks
but, after this trend line is drawn, and then what .... ?
will it be too late to know after these few color line is drawn
maybe I never know how to read trend lines
Is there any new updated news about super signals to solve the problem of suddenly appearing and disappearing arrows in the several past bars ?
...
Is there any new updated news about super signals to solve the problem of suddenly appearing and disappearing arrows in the several past bars ?
BREAKING NEWS!!!...This is just in! The disappearing arrows are here to stay!...like forever!:)
Need fractal signals : arrow up and price above 200EMA and arrow down and price below 200EMA
preffered to add to existing (super signal ) fractal indicator in post #272 with alert....All signals should have switch false/true....
Reason for these signals is to filter out possible trades. that would also reduce screen time
Thank you
@mladen: Is the "Fractals - adjustable period trend lines"-indicator a non-repainting indicator?
No
As any fractals it is a repainting (recalculating) indicator
@mladen: Is the "Fractals - adjustable period trend lines"-indicator a non-repainting indicator?