Cartesian Coordinates?
Hi: I am working with a programmer to do a graphical display (circles). He states that MT5 cannot perform this task since the math formula that is necessary requires a Cartesian coordinate system. He states
"I'm afraid it's not possible, chart has got non-cartesian coord. system with two independent axes representing price and time.
For such calculations and plots it's necessary to have a system with fixed scaling per both axes.. "
Can the function ChartTimePriceToXY perform this? https://www.mql5.com/en/docs/chart_operations/charttimepricetoxy
Any other ideas or feedback would be appreciated!
Please find another coder because he/she is wrong.
You can draw perfect circles on the chart and much much more then that too.
Please find another coder because he/she is wrong.
You can draw perfect circles on the chart and much much more then that too.
Indeed, however if you want to keep the graphics aligned with the candle charts your options are quite limited
1) X axis points are snapped to the bar times so cannot start on any of the pixels in between the bars
2) Text fonts are not scaled with the chart so cannot easily be kept in alignment with the underlying graphics
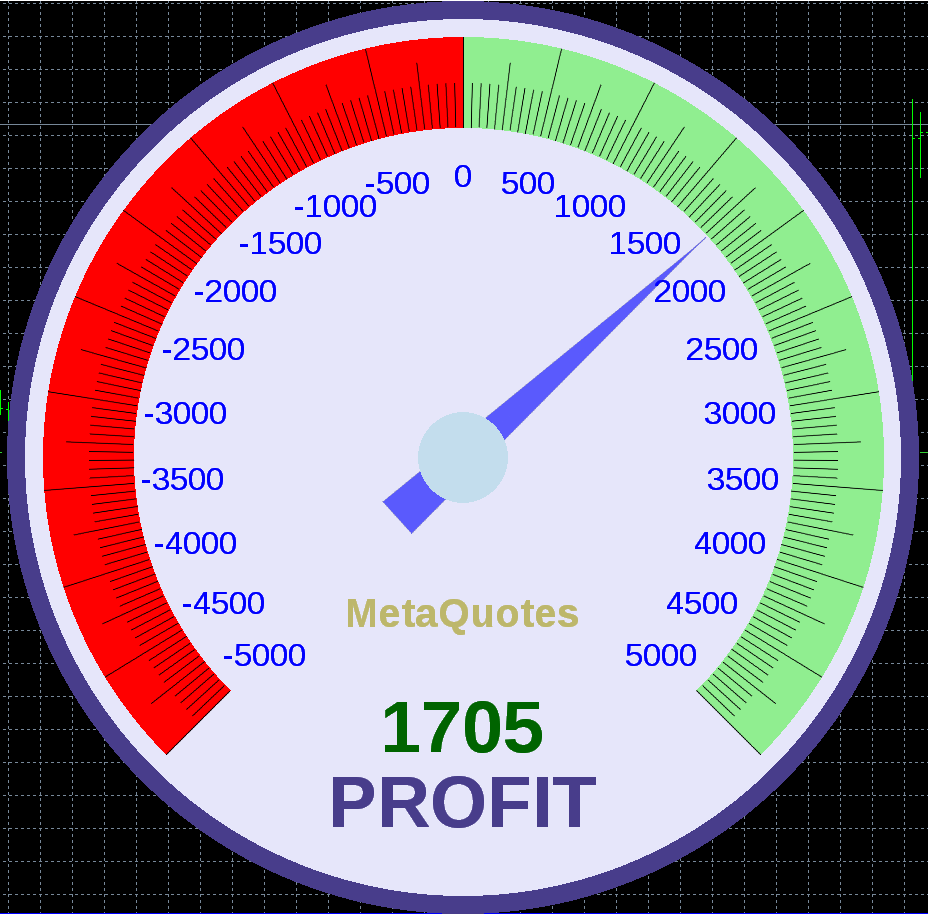
Everything can be made scalable.
This one above will automatically redraw in smaller/larger size whenever chart dimensions change.
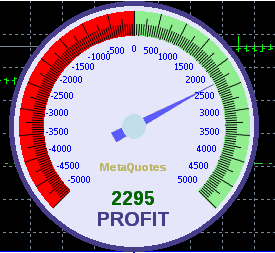
As you can see font scales down with the underlying graphic.
Everything can be made scalable.
This one above will automatically redraw in smaller/larger size whenever chart dimensions change.
As you can see font scales down with the underlying graphic.
Do you have a code example for this or something like it?
It looks like this graphic is fixed to the screen view not attached to the chart.
Is it possible to draw graphics like this that follow the underlying chart and not stay static on the screen when you move the underlying chart ?
Your image on the other hand is a perfect circle that seems to be anchored to the "pixel" scale (or maybe just anchored by one of its corner points to a particular time/price), but not a "Cartesian" representation completely anchored to the time/price scales.
One could probably achieve that with intricate canvas/pixel mapping continuously updating for that, but it will probably be much too complex and taxing on the CPU in order to achieve true "Cartesian" representation on the "time"/"price" chart.
Of course it is a fixed (anchored) image otherwise the gauge would be moving over the screen when scrolling the chart which is unwanted.
In this case there is no cpu load because the image only gets resized when the chart dimensions change like this:
{
chartwidth=ChartGetInteger(0,CHART_WIDTH_IN_PIXELS);
chartheight=ChartGetInteger(0,CHART_HEIGHT_IN_PIXELS);
Redraw();
}
I understand that the circle would become elliptical when pegged on time and price axis but i do not expect insane cpu load i am quite sure it can be done.
And i would write an example but i do not have the time to draw circles on charts all evening.
you can also draw bmp label. Unfortunately, MetaTrader does not handle 32bit BMP with transparency so you have to live with either white or black corners.
CBmpButton m_button;
input string fileName="\\Images\\lovecircle.bmp";
input string objectName="lovecircle";
int OnInit()
{
if(!m_button.Create(0,objectName,0,10,10,50,50))
Print("unable to create bmp label " + GetLastError());
m_button.BmpNames(fileName,fileName);
//---
return(INIT_SUCCEEDED);
}
Of course it is a fixed (anchored) image otherwise the gauge would be moving over the screen when scrolling the chart which is unwanted.
In this case there is no cpu load because the image only gets resized when the chart dimensions change like this:
{
chartwidth=ChartGetInteger(0,CHART_WIDTH_IN_PIXELS);
chartheight=ChartGetInteger(0,CHART_HEIGHT_IN_PIXELS);
Redraw();
}
I understand that the circle would become elliptical when pegged on time and price axis but i do not expect insane cpu load i am quite sure it can be done.
And i would write an example but i do not have the time to draw circles on charts all evening.
This will cope with resizing of the window, but it won't really solve the underlying issue.
What we need is a way to determine the number of pixels between each bar so you can resize our "Canvas" or bitmap accordingly when the timeframe is changed or the chart is resized. If we had the correct pixel sizes we could then redraw the "canvas" to cover the new daterange/timespan and leave it attached at the same date/price.
It might be a bit tricky.. but if someone has the time it might be worth the effort. (and would permit some more advanced "inline" graphics on the charts)
Circles might still be ellipses, but that would be expected when the price scale is not fixed
- Free trading apps
- Over 8,000 signals for copying
- Economic news for exploring financial markets
You agree to website policy and terms of use
Hi: I am working with a programmer to do a graphical display (circles). He states that MT5 cannot perform this task since the math formula that is necessary requires a Cartesian coordinate system. He states
"I'm afraid it's not possible, chart has got non-cartesian coord. system with two independent axes representing price and time.
For such calculations and plots it's necessary to have a system with fixed scaling per both axes.. "
Can the function ChartTimePriceToXY perform this? https://www.mql5.com/en/docs/chart_operations/charttimepricetoxy
Any other ideas or feedback would be appreciated!