Creating a JPG image from a custom graphic
Please see: https://www.mql5.com/en/search#!keyword=graphical%20interface&module=mql5_module_articles
If you want to work with visual objects on chart in MQL.
It's possible to create even more complex items then that strategy tester graph.
For example:
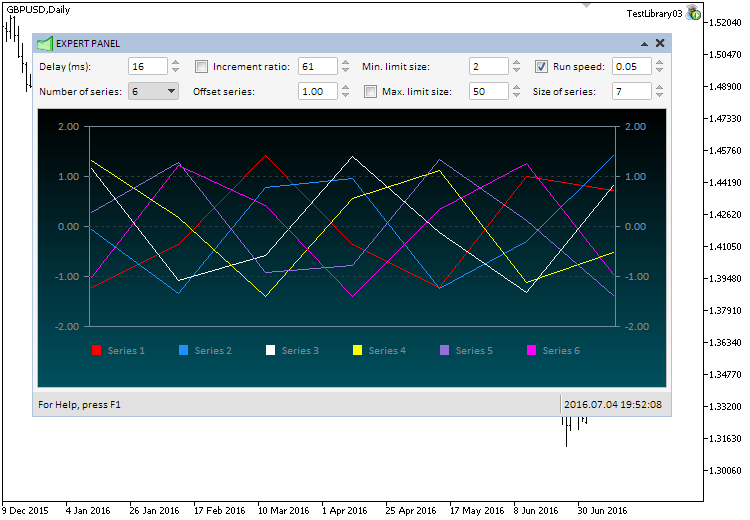
source: https://www.mql5.com/en/articles/2580
Otherwise you can also use a free api from Google called G-Chart: https://developers.google.com/chart/interactive/docs/gallery/piechart#donut
Which allows you to create interactive content with javascript.
Or any other tool of course.
Thanks @Alain Verleyen, with ResourceSave() it works:
ResourceSave(graphic.ResourceName(), "test.bmp");
I also found an interesting article about the class CGraphic, very good, but not in english yet: https://www.mql5.com/ru/articles/2866

Визуализируй это! Графическая библиотека в MQL5 как аналог plot из R
- 2017.02.07
- MetaQuotes Software Corp.
- www.mql5.com
При исследовании и изучении закономерностей важную роль играет визуальное отображение с помощью графиков. В популярных среди научного сообщества языках программирования, таких как R и Python, для визуализации предназначена специальная функция plot. С её помощью можно рисовать линии, точечные распределения и гистограммы для наглядного представления закономерностей. В MQL5 вы можете делать всё то же самое с помощью класса CGraphics.
Gustavo Hennemann:
Thanks @Alain Verleyen, with ResourceSave() it works:
Yes they introduced new graphics libraries very recently.
Thanks @Alain Verleyen, with ResourceSave() it works:
ResourceSave(graphic.ResourceName(), "test.bmp");
I also found an interesting article about the class CGraphic, very good, but not in english yet: https://www.mql5.com/ru/articles/2866You are missing trading opportunities:
- Free trading apps
- Over 8,000 signals for copying
- Economic news for exploring financial markets
Registration
Log in
You agree to website policy and terms of use
If you do not have an account, please register
Inside my EA I'm trying to create a button to export a personal graphic of equity curve, or histogram of operation, or any kind of graphic. But I'm didn't find a way to export to JPG or BMP. In realy I'm trying to do a personal report.
I already looked inside some classes, examples and files like "Graphic.mqh", "Axis.mqh" and "Curve.mqh" but there is no "Save" or "Export" method.
I spect to create a graphic, not necessary to be a visual object, add some X, Y points, and finally save in a ordinary image file. If is possible to customize some collors, good, if not, also good (one step at once). As a first goal I expect to creat an image like the standard backtest equity curve:
If anybody have a clue on how to do it, I really appreciate,
Thanks in advance