Forum on trading, automated trading systems and testing trading strategies
Something Interesting to Read February 2015
Sergey Golubev, 2015.02.16 10:11
Naked Forex: High-Probability Techniques for Trading Without Indicatorsby Alex Nekritin

Most forex traders lose because they persist in believing three myths
of successful trading:
- Myth 1: successful trading must beindicator-based.
- Myth 2: successful trading must be complex.
- Myth3: successful trading is dependent on the trading system. Well, it's time to get over these misconceptions and start winning, sayauthors Alexander Nekritin and Walter Peters in Naked Forex.
Long before computers and calculators, trading was handledwithout complex technical analysis and indicators. Trading was old school - based on using only price charts - and it was simple, profitable, and easy to implement. In Naked Forex, they show you how to successfully trade this way.
This
lively, three-part book lays out the authors' techniques indetail:
- The first part walks you through the fundamentals of forextrading and establishes the ruling tenet of all naked forextrading: price is king.
- In Part Two, the authors share methods thatlead to profits, including using resistance zones, price patterns,transitions, and such intriguing trade setups as Wammies, Moolahs,and the Last Kiss.
- In the last part of the book, you'll learn tounderstand your own trading psyche. Mastering your own attitudestoward risk, says coauthor Peters, who is also a PhD in psychology,is how you finally become a true professional trader.
Engaging and informative, this practical guide touches on many provocative topics, including:
Is it possible to outwit some of the most determined,intelligent, and well-resourced traders in the world? Find out whatit takes
The concept of "zones" and the seven most important things youneed to know about them
Six key stages you must address for every trade
Are you a runner or a gunner? When it comes to exiting a tradewith money, it's important to know
The one secret expert traders all share, why boring is good, andsix steps to becoming an expert
Why understanding yourself is paramount. What is your attitudetowards money? What are your biases? Find out how to find out
Naked trading is liberating, exhilarating, and frees you to focus on markets, instead of the indicators, say Nekritin andPeters. Follow their proprietary techniques to profitability with Naked Forex.
My plan is to design, develop, code and test a complete system based on naked forex.
The most tricky part and most important part is the S/R zones.
But first let me summarize entries and exits of the system.
Entries : Valid only at S/R Zones:
- The Last Kiss :
- This setup is designed to minimize breakout fake-outs.
- Price gets contained in a range between two S/R zones.
- Price breakouts in one direction.
- Wait for price to come back to the range breakout point and "Kiss" (Touch, Test) it before reversing in the breakout direction.
- If price prints a reversal pattern (Engulfing, Pin Bar .. etc) at the breakout edge, we place our pending stop order above the pattern.
- The Big Shadow :
- The Big Shadow is similar to an Engulfing Candle.
- The Bigger the Better
- Candle should close near its high if bullish, or near its low if bearish, the Nearer the Better
- Wammies and Moolahs:
- These are similar to W (double bottom) and M (double top) patterns.
- Kangaroo Tails:
- This one is similar to Pin Par.
- The Big Belt:
- This is similar to Belt Hold candles.
With all these patterns, Entry is always via a pending stop order few pips above/below the pattern.
Exits :
- Stop Loss is below/above the lowest/highest point of the entry pattern.
- Take Profit is at the nearest S/R Zone
- Partial Profit can be taken at the nearest S/R Zone, and the remaining position can be trailed by previous S/R Zones
I will provide detailed description and recent chart examples on these candles/patterns later on after we cover the S/R Zones.
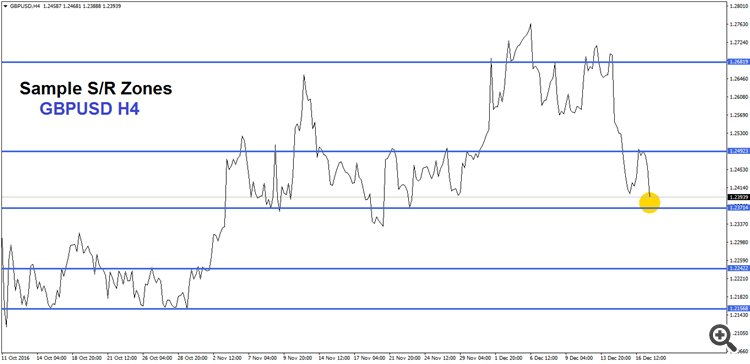
This is "my" view on S/R Zones on current GBPUSD H4 Line chart.
I'll be grateful if you share "yours" because the target of this stage is to find a "systematic" way of defining S/R Zones in order to study the possibility of automating them.
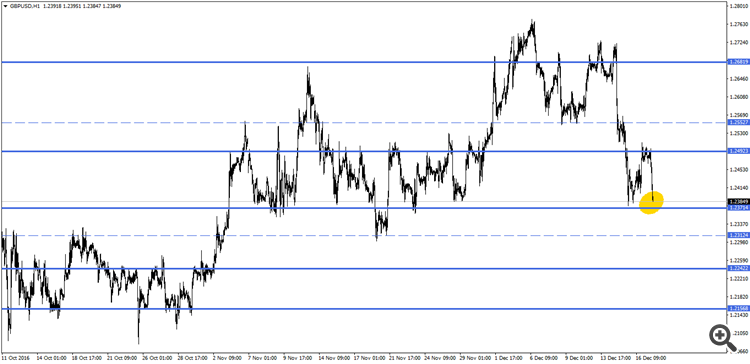
And this is how they appear on H1 Candle Stick Chart.
The 2 dotted lines are S/R zones missed from the H4 chart.
I don't see good activity on MQL forums.
So I will pause here and continue this research on my own.
I don't see good activity on MQL forums.
So I will pause here and continue this research on my own.
?? - What do you expect?
I think most of the readers don't know that interesting system - so they are just reading.
Just a few responses doesn't mean nobody is interested.
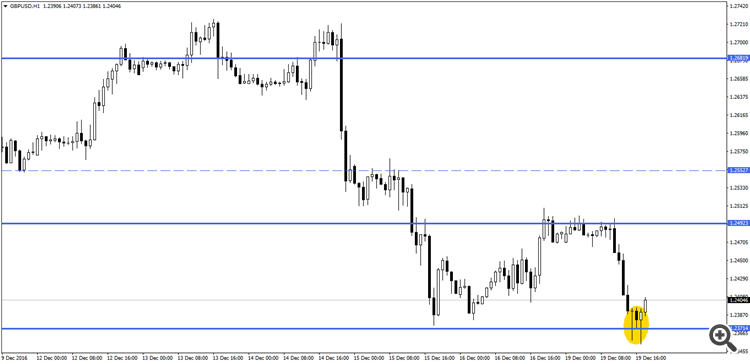
Show some trades: before and after entering, stops and targets and the final exit on higher and lower timeframes..
?? - What do you expect?
I think most of the readers don't know that interesting system - so they are just reading.
Just a few responses doesn't mean nobody is interested.
Show some trades: before and after entering, stops and targets and the final exit on higher and lower timeframes..
Thank You,
I was expecting something like this http://www.forexfactory.com/showthread.php?t=624820, just started today.
- Free trading apps
- Over 8,000 signals for copying
- Economic news for exploring financial markets
You agree to website policy and terms of use


Naked Gun Trading System
Naked Gun trading system was inspired from the "Naked Forex : High-Probability Techniques for Trading without Indicators" Book by Alex Nekritin and Walter Peters, 2012.
The system idea is to trade specific reversal candle stick patterns at support and resistance (S/R) zones.
S/R Zones
The corner stone of the system is the support and resistance (S/R) zones.
These zones are areas on the chart where price reversed repeatedly.
The importance of a zone increases with the number of times it was respected as as S/R zone.
Finding S/R Zones
It is recommended that we find these zones using the line chart on a higher time frame, so if you are trading the daily chart you will find these zones on the weekly chart.
The line chart reveals zones easier than candle stick or bar charts, because the zones will be identified by repeated bends in the line.
The found zones should be spread out at fair distances, as they represent critical areas on the chart, and price does not reach these critical areas so often.
I will add example charts with identified S/R zones in my next posts.