6th Degree Poly Help!
- Adaptive digital filters
- There are several things confusing me, and I need to know if they are possible at all
- Dividing open positions into groups
The i-regr indicator can do arbitrary polynomial regressions to any degree. I have never attempted anything higher than 3rd degree, but the code is there for you to look at. 6th degree will probably kill your CPU, but you can give it a try.
The i-regr indicator can do arbitrary polynomial regressions to any degree. I have never attempted anything higher than 3rd degree, but the code is there for you to look at. 6th degree will probably kill your CPU, but you can give it a try.
Thanks rocketman! Didn't kill my CPU at all - I'll work with this for awhile using and see what I come up with.
Update:
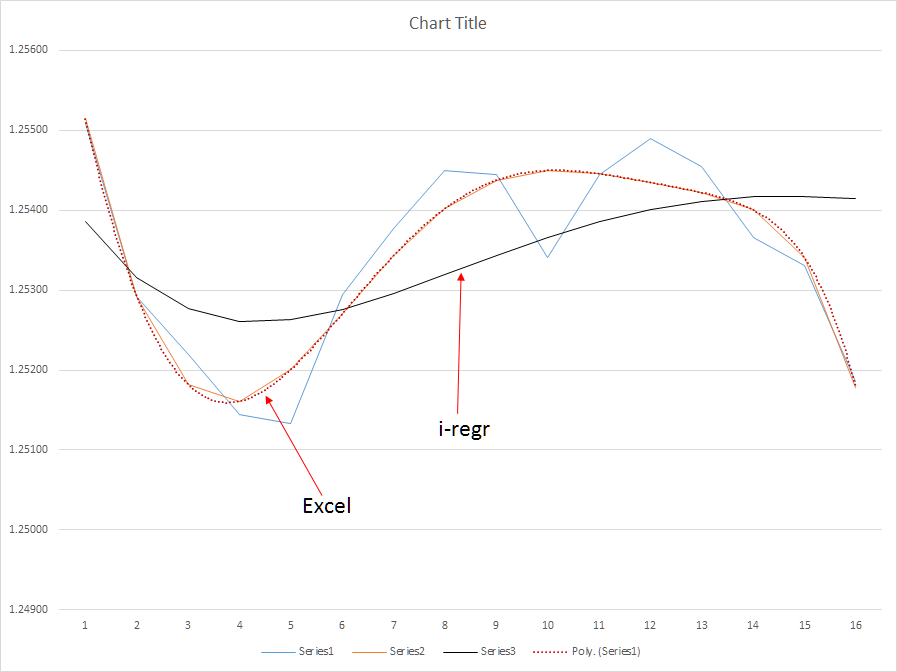
i-regr doesn't seem to have a high degree of accuracy - could be possibly due to the gauss (i-regr) and least squares (excel) method used to solve. I don't know - still looking, anyone have any better poly procedures?
i-regr is working on Close[] value of every bar, which probably makes difference (i guess that you have equalized the pattern lengths in MT4 and excel).
you can change this easily by changing Close[] to Open/High/Low or to any other analytical expression e.g. weight function.
however i don't believe that you can make a profit out of this, it is just like any other repainting trend indicator.
Hi dennisj2,
are you sure you really need your formula?
May be you try first to search for other filters like Kalman, Ehlers, Gauss, Jurik (JMA), DEMA. Most of them derived from low-pass (physical) frequency filters and most of them have found their way into mt4-code.
May be a JMA (there are many variations) with a longer period-set does what you are looking for?
Now my quest begins.
Now that I identified a practical application, I sought to learn (or, in my case, re-learn) the math behind the poly trend line formula. Good luck with that. Least squares reduction and matrices added to the extremely complex formula and required coefficient calculations introduced by the polynomial equation is far too difficult (for me) to translate into code. So, I figured it would be easiest to call Excel (most likely from c++), supply an array of (x,y) data values, compute the poly (x,y) intercept (trendline value) using LINEST(), and returning this value back to my desktop application (a closed proprietary software app with limited call-out functionality).
Assembling the formula using LINEST() has become a substantial hurdle. It's easy enough to supply the data - but, how can I compute the (x,y) intercepts shown so flawlessly on the graph? Every new measure changes the formula and uses newly calculated coefficients? Why does this happen? I have spent hours, upon hours (and then some) scouring the internet for solutions - and (just like a man) have decided finally to ask for directions.
I've got the source values (years upon years of it). What I'm missing is a) the method to generate the poly(x,y) intercept, b) by calling Excel externally to c) return the poly(x,y) based on supplied (x,y) data -
If anyone has an article or very specific treatment of this topic, or even willing to lend a hand, I would be forever in your debt.
dj
There are a lot of articles out there about algebra with examples in Greek but really it is voodoo.
For example there is a wikipedia article about linear regression that makes no sense to me at all, yet I could code a linear regression version of your line right now because somewhere else I learned to use the formula
y=a+bx
Yet nowhere in the wikipedia article is that formula even mentioned, how can that make sense ?
also I learned when using that formula
a == slope
b== intercept
the math for calculating slope and intercept is known and is pretty simple procedure of calculating the sums of the values, squaring some of them etc.
I also know the formula for a quadratic regression (2nd degree) is y=ax^2 + bx + c
So I am thinking they are related which should mean the equation for 3rd degree regression is
y=ax^3 + bx^2 + cx + d
so I think the 6th regression would be
y=ax^6 + bx^5 + cx^4 + dx^3 + ex^2 + fx + g
but if a is slope and b is intercept what is c and what would be d etc ? That is the only reason I could not code your line, I don't know what the coefficients are or how to calculate them.
UPDATE: ok I learned something else which is confusing me now.
in another article quadratic polynominal is described as
ax^2 + bx + c = 0
Does that mean we dont need to know the math for slope intercept at all and we could solve the quadratic to find the values of a, b and c ?
But how does ax^2 + bx + c = 0
relate to
y=ax^2 + bx + c ?
They look similar but how come one is y= and the other is =0 ?
SDC,
the slope in one point can be calculated by the first derivation of a function.
A linear function like y=ax+b has at any point the same slope: a.
In general the derivation of a linear function ax^n + bx^n-1 + ... + z = y is simply: nax^(n-1) + (n-1)bx^n-2 .. = y' - the last constant of the original function becomes 0, always!
So ax + b = y => y' = a ( <= 1*a^(1-1); b=0 )and the quadratic function becomes y' = 2ax + b ( <= 2ax^(2-1) + 1bx^(1-1); c=0 ).
But I think to understand the idea of filters you better think (and read) about filtering frequencies. No matter whether it is sound or pictures or quotes or ..
One always want to get rid of the noise - in general - the shorter term frequencies. And the use of linear functions is just one approach.
Thanks for trying to explain that to me but I don't know why those equations mean what they mean. If I know how to calculate the coefficients individually in a procedural way I can use them and plug in the values but that's about it.
I do understand the concept of filters, I was just interested in figuring out how to code the OP's line.
But in regard to doing that, when you say,
"So ax + b = y => y' = a ( <= 1*a^(1-1); b=0 )and the quadratic function becomes y' = 2ax + b ( <= 2ax^(2-1) + 1bx^(1-1); c=0 )."
I have no clue what you are talking about or even how that is relevant so I probably wont be doing any poly line coding any time soon lol
SDC:
There are a lot of articles out there about algebra with examples in Greek but really it is voodoo.
SDC - you are now at the same level that I am - the linear regression formula I found works - and there are two distinctly different formulas I found that produce identical results. These formulas are great if linear regression (a straight trend line) is what we were after.
First, some reference material:
Microsoft: http://office.microsoft.com/en-us/excel-help/linest-HP005209155.aspx
IntegralCalc: https://www.youtube.com/watch?v=1pawL_5QYxE&noredirect=1
Given the linear regression equation y = mx + b:
Where y = price, (e.g., Close[x])
and x = index (e.g., Bar[x])
and m = Slope (the coefficient applied to each (x,y) pair)
and b = Y-intercept (the base value of Y-intercept applied to each (x,y) pair)
Method A: From IntegralCalc Method B: From Microsoft (where x(overbar) and y(overbar) are means)


Even the polynomial regression trend line formula to the nth degree is relatively easy to apply:
Given the formula: y = m1*x1 + m2*x2 + m3*x3 + ... + b
Where the variables x, y, m, and b carry the same definition described in the linear equation.
Seems I have everything, so what's missing?
What is missing is the calculation for the m (Slope) and the b (Y-intercept) for a polynomial regression; the linear equation for computing these values does not apply to a polynomial regression. From what I've learned, the polynomial regression requires a formula that calculates least squares based on a system of polynomial equations using a matrix. Look at the example graphs above. In the first graph, the poly(6) lines are absolutely immaculate - tops and bottoms are clearly called out. With this data, I will be able to hold trades longer than I do today ultimately doubling, potentially tripling my average pips per trade.
In the second graph, I show the results of the poly(6) vs. the i-regr method that uses a gauss matrix to solve for the slope coefficients - and, needless to say, it's fairly useless due to the substantial latency of the method. On the other hand, a simple moving average is even worse - the SMA is far too sensitive during intermediate market corrections that could cause an overreaction of my EA.
I am willing to pay someone to develop a true polynomial regression indicator - but, the results absolutely must mirror the results that Excel produces. The LINEST() function is a black box where much voodoo is used to calculate the coefficients. Quite simply, I need to understand this voodoo.
Update: I attached a file showing the method implemented in Excel.
i-regr is working on Close[] value of every bar, which probably makes difference (i guess that you have equalized the pattern lengths in MT4 and excel).
you can change this easily by changing Close[] to Open/High/Low or to any other analytical expression e.g. weight function.
however i don't believe that you can make a profit out of this, it is just like any other repainting trend indicator.
Grazi -
I used the i-regr and compared the results above - the Poly(6) algorithm vs. i-regr shows the i-regr has a substantially greater latency then the poly(6) based on the same set of data - latency is death in this market. My EAs don't trade intraday oscillation but rather, hold for the trend. So, you are mistaken - I do profit from my EAs and, with a slower reactive indicator, my EAs will capture more of the market then they do today. Specifically, once I've integrated a true poly(6) algorithm, I'll have the ability to hold open positions longer and predict trend changes 3-4 periods earlier improving my entry points.
- Free trading apps
- Over 8,000 signals for copying
- Economic news for exploring financial markets
You agree to website policy and terms of use