MQL4 Debugger (Since Build 600)
Hello,
Have never used MT5, but now having been forced into build 600+, was trying to take a look at the debugger. Has anyone used this (successfully)? Is there any documentation about it?
I placed a couple breakpoints and tried to start (F5); it opened a chart, choosing H1 AUDCAD, which would not work for my EA. I located the settings and put in EURUSD M5, but then the debugger would not start at all. It would only start if I did NOT specify this info (i.e. "Use specified symbol and period" in the Debug tab was UNchecked.)
Even if that were working (or I was ok with AUDCAD H1)... then what? Does it just sit there and run per usual until a tick sends it through some code where you have a breakpoint? If so, what is the use? To be useful, it would have to do something like a backtest/simulation.
And the help mentioned something about being able to do watch variables... does that exist? I noticed there was very little help regarding the debugger; only a short (inaccurate) overview, but maybe it was written for MT5.
LOTS of questions about this new possibility of finally being able to do debugging; was surprised I did not find a forum topic on it already existing. If I have missed one, someone please post a link to it.
Thanks.
You can see help file of MetaEditor. Menu Help, Help Topics (not mql4 reference). Then search for debugging. You can also search more information at mql5.com.
However from my experience, I don't think it's ready yet. Seems there is a lot of bug in the debugger. Be patient.
It is so simple, that there is probably no need for discussion. I am surprised that it does not work for you; actually it has been working for me from the very beginning, whichever symbol or timeframe I set. There are issues - the Terminal gets frozen with the debugger frequently (so the editor seems dead as well until the terminal gets killed).
It can evaluate the watch variables, though it can't inspect content of objects. It works correctly with macro substitutions and templates. It does not reveal the original object type if the object is casted.
What I am missing most is that it does not evaluate the return values, nor the parameters at a function entry point.
Hi guys!
I have the same questions.

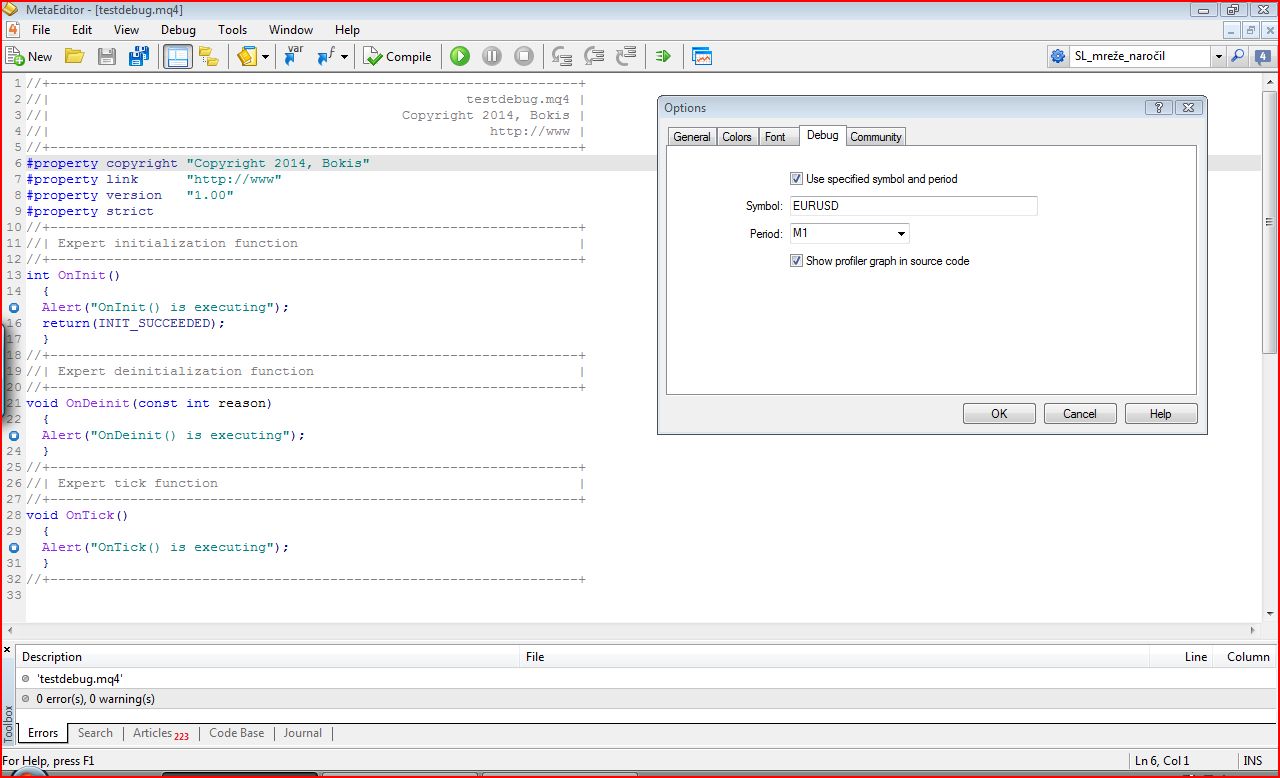
1. I installed new last release of MT4 and Meta Editor above, I wrote simple code in mql4 (look on Meta Editor picture below) and I put one Breakpoint at Alert in every special function just for testing debug function.
2 I Filled out Tools/Options/Debug parameters in Meta Editor (look on Meta Editor picture below).
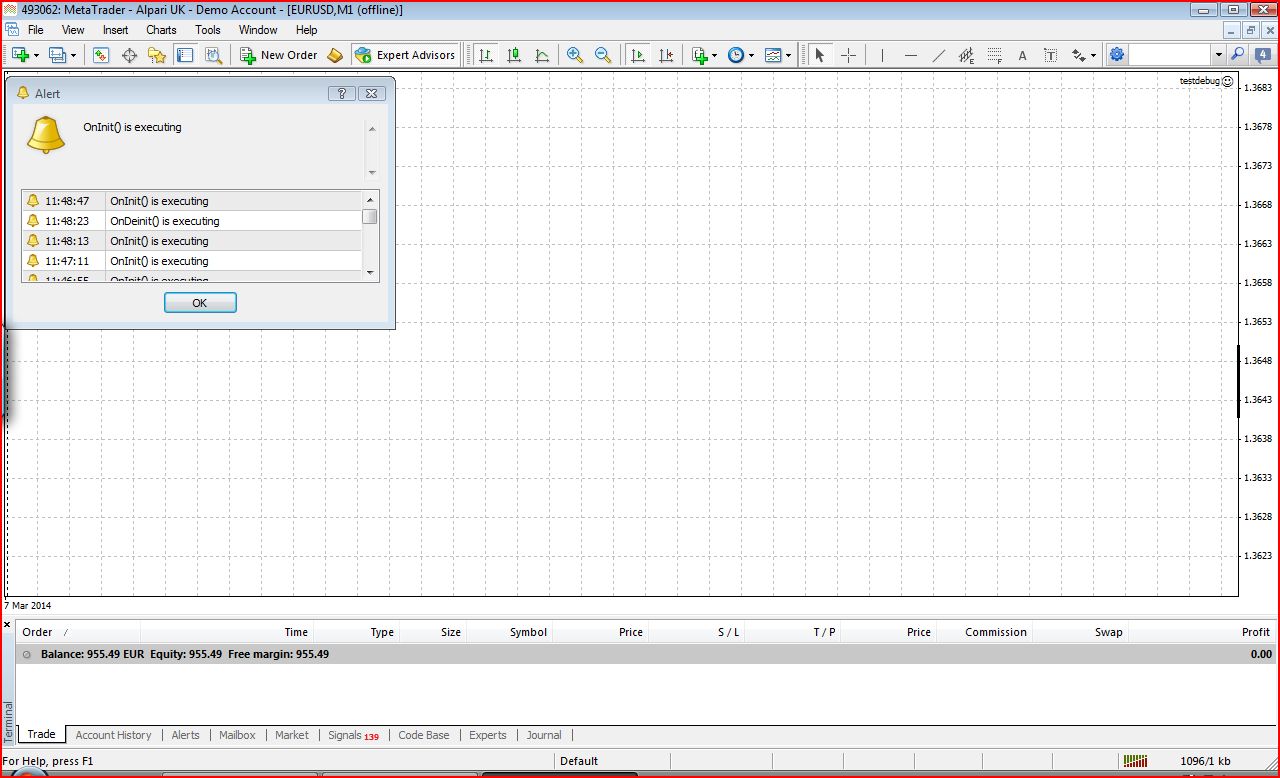
3. Than I prepared and loged on my Demo account. (look on Chart and Tradeing terminal picture below).
4. I hit Start debugging (F5) in Meta Editor. Debugger loaded Expert Advisor on Chart successfully. I enabled expert Advisor.
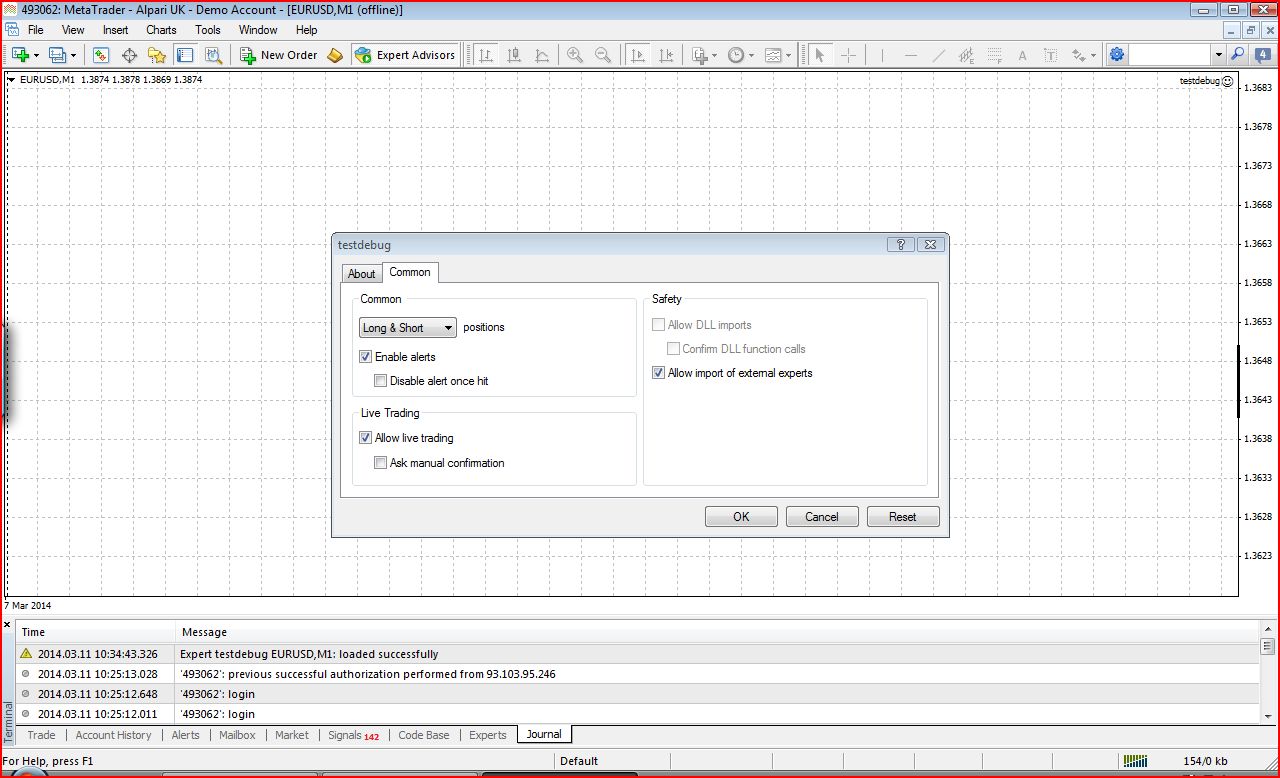
5. I fill and hit OK in dialog box on Chart window above and I got this situation in Meta editor below where debbuger stoped on first breakpoint (green arrow) in onInit() function. Everything works fine untill end of onInit() special function.

Whatever I press after that, debuger falling in state when Start debug button is inactive and green arrow which point on breakpoint disapearing. Look on Pictures below.
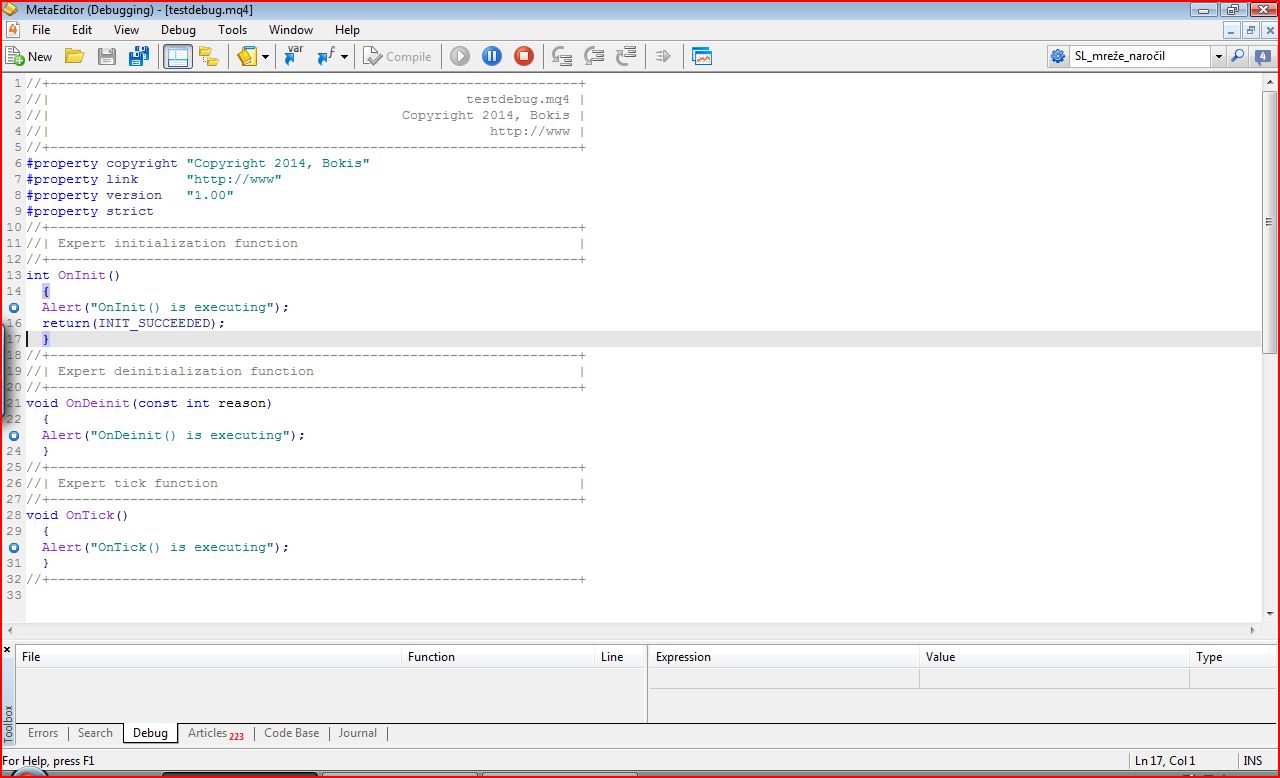
Can anyone suggest how to continue from that point or how to get tick from trade terminal for continuing debugging in onTick() special function where main code should be.
Thanks
Bokis
Hi guys!
I have the same questions.
1. I installed new last release of MT4 and Meta Editor above, I wrote simple code in mql4 (look on Meta Editor picture below) and I put one Breakpoint at Alert in every special function just for testing debug function.
2 I Filled out Tools/Options/Debug parameters in Meta Editor (look on Meta Editor picture below).
3. Than I prepared and loged on my Demo account. (look on Chart and Tradeing terminal picture below).
4. I hit Start debugging (F5) in Meta Editor. Debugger loaded Expert Advisor on Chart successfully. I enabled expert Advisor.
5. I fill and hit OK in dialog box on Chart window above and I got this situation in Meta editor below where debbuger stoped on first breakpoint (green arrow) in onInit() function. Everything works fine untill end of onInit() special function.
Whatever I press after that, debuger falling in state when Start debug button is inactive and green arrow which point on breakpoint disapearing. Look on Pictures below.
Can anyone suggest how to continue from that point or how to get tick from trade terminal for continuing debugging in onTick() special function where main code should be.
Thanks
Bokis
Thank you angevoyageur. I'm happy that it works for you, because somehow it should works for rest of us too. What do you think I'm doing wrong that debugger doesn't want to jump from OnInit() function to OnTick() function. Thanks a lot.
OK. I meant why debugger after execution of "return(INIT_SUCCEEDED) at the end of OnInit()", does not pass control to first line of OnTick() function. Thanks.
At last, I found solution for my bug described above. I deleted debug.tpl which I created at start, because it was responsible for hanging of the debugger on OnInit() function and terminal was never allowed to pass controll to OnTick() function. Now the Debugger works fine in OnInit() function. I hope this solution will help other members to using debugging possibility successfully too.
Thanks for help
I reported this bug some time ago. Should have been fixed.
Terminal 618.
Defect: When the chart template is saved, it includes its offline attribute. When it is loaded as Default.tpl or Debug.tpl , the attribute overrides the natural timeframe values of new charts.
I did not investigate other templates like Tester or templates following a script name, they may be affected as well.
How to reproduce:
1. Open any offline chart. Save its template with name "debug.tpl". Close the terminal. Start any script in the debugger. The debugger opens an offline chart to run the script on.
2. Open any offline chart. Save its template with name "default.tpl". Open new chart from File->New Chart menu. Restart the terminal. The chart is now in offline mode, not updating.
3. Open any regular chart. Save its template with name "default.tpl". Restart the terminal. Open any offline chart with menu File->Open Offline. The chart opens with no data rendered, and generates "History synchronization error" if refreshed.
Expected behaviour: The offline attribute is ignored in templates, and the chart type is guessed according the timeframe if chart is open with a template.
Thank you. Fixed.
Please wait for the next build
- Free trading apps
- Over 8,000 signals for copying
- Economic news for exploring financial markets
You agree to website policy and terms of use
Hello,
Have never used MT5, but now having been forced into build 600+, was trying to take a look at the debugger. Has anyone used this (successfully)? Is there any documentation about it?
I placed a couple breakpoints and tried to start (F5); it opened a chart, choosing H1 AUDCAD, which would not work for my EA. I located the settings and put in EURUSD M5, but then the debugger would not start at all. It would only start if I did NOT specify this info (i.e. "Use specified symbol and period" in the Debug tab was UNchecked.)
Even if that were working (or I was ok with AUDCAD H1)... then what? Does it just sit there and run per usual until a tick sends it through some code where you have a breakpoint? If so, what is the use? To be useful, it would have to do something like a backtest/simulation.
And the help mentioned something about being able to do watch variables... does that exist? I noticed there was very little help regarding the debugger; only a short (inaccurate) overview, but maybe it was written for MT5.
LOTS of questions about this new possibility of finally being able to do debugging; was surprised I did not find a forum topic on it already existing. If I have missed one, someone please post a link to it.
Thanks.