Custom edit and Adjust level indicator tool
Hi
I've built a code to an automatic indicator which calculate the range between 2 swing points (for Gann) and divide the range by a custom number (either 8 or 10) and than draw it on the chart and also draw a vertical line for the time forecast.
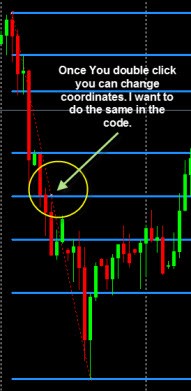
Now I want to be able to edit and adjust the swing point manually (I want to choose where the starting and end point will be), just like you use the Fibonacci Retracement or Expansion regular tools.
How can I get the coordinates (price / time) ?
What changes do I need to make in my code ?
Thanks
no extern input for place where you want to start or end
       HighValue=High[iHighest(NULL,0,MODE_HIGH,Cycle,1)]; //Calculate the highest relevant point
       LowValue= Low[iLowest(NULL,0,MODE_LOW,Cycle,1)]; //Calculate the lowest relevant point
       HstBar=Time[iHighest(NULL,0,MODE_HIGH,Cycle,1)]; //get the time
       LstBar=Time[iLowest(NULL,0,MODE_LOW,Cycle,1)];  //get the time
see nowhere an attempt yours to change the calculated values to what your input will be
Yes, that's exactly what I'm asking.
How can I get the new values (after I change the start/end point manually) - just as you can adjust the Fibonacci Retracement tool when you use it.
How can I get these coordinates ?
Once I'll know how to get these coordinates I'll have HighValue, LowValue, HstBar, LstBar.
It is so Simple that i almost wondering that if you're able to change code
you don't know how to do this
extern double firstinput = 0;


//in start
       if(firstinput > Point)HighValue = firstinput;
         else HighValue=High[iHighest(NULL,0,MODE_HIGH,Cycle,1)]; //Calculate the highest relevant point
Thank you
however I think I was misunderstood.
I need change my code so I'll be able to change the coordinate manually just as you double click on the Fibonacci Retracement tool and can change the coordinates (choose different swing points).
At the moment I can't change the coordinates manually.
How do I do that, how can I get these coordinates (change with the mouse) ?, should I use some kind of a modified code for Fibonacci such as
ObjectCreate("custom levels ",OBJ_FIBO,x,x,LowValue,x,HighValue) ?
Sorry if it's a stupid question, I've looked for it but couldn't find it.
Thanks
Thank you
however I think I was misunderstood.
I need change my code so I'll be able to change the coordinate manually just as you double click on the Fibonacci Retracement tool and can change the coordinates (choose different swing points).
At the moment I can't change the coordinates manually.
If you mean that you want to be able to give your EA some user input the best way to do that is by moving an Object manually on the chart and then have your EA read the position of this Object when it is moved . . . if you just want a price use a price label arrow
Yes that's exactly what I want.
So you mean like in https://www.mql5.com/en/forum/134261 ? and than just use ObjectMove or redraw all lines ?
Yes that's exactly what I want.
So you mean like in https://www.mql5.com/en/forum/134261 ? and than just use ObjectMove or redraw all lines ?
I am thinking more about doing it like https://www.mql5.com/ru/code/10802
Looks interesting.
I'll check it.
Thank you very much
I've took you're advice ( https://www.mql5.com/ru/code/10802) and now the levels are drawn after I draw a trend line and change it's name to Gann.
However the lines don't change after I change the coordinates of the trend line and I can't figure out why.
Can you please help ?
Thanks in advance
I've took you're advice ( https://www.mql5.com/ru/code/10802) and now the levels are drawn after I draw a trend line and change it's name to Gann.
However the lines don't change after I change the coordinates of the trend line and I can't figure out why.
Can you please help ?
Thanks in advance
OK explanation how to do
if (ObjectType(TrendName)== OBJ_TREND)
you look if P1 P2 T1 T2 are same values as you find with objectget
if one of them is different you have to delete the horizontal lines of the indicator
and calculate the new distance between the lines
with 8 lines then there are 7 areas between high and low
now you have to create the new lines with the new distance
also in deinit you have to delete the objects of the indicator
try to do this yourself and we help you further
or place a job at Jobs and i can give it you there if you pay me for this $10
- Free trading apps
- Over 8,000 signals for copying
- Economic news for exploring financial markets
You agree to website policy and terms of use
Hi
I've built a code to an automatic indicator which calculate the range between 2 swing points (for Gann) and divide the range by a custom number (either 8 or 10) and than draw it on the chart and also draw a vertical line for the time forecast.
Now I want to be able to edit and adjust the swing point manually (I want to choose where the starting and end point will be), just like you use the Fibonacci Retracement or Expansion regular tools.
How can I get the coordinates (price / time) ?
What changes do I need to make in my code ?
Thanks