Horizontal trend lines & zoom
- The line connects two bars. The bars widen, so does the line. You can't have a one bar wide tline.
- You can use an arrow with code 4 but that is only under one bar. (Haven't tried it, but I doubt it expands either.)
Not sure what you mean in 1. - if the time element was that small the line would be useless.
For my purposes I need to use a horizontal line, not an arrow.
It would have been fine if an HLINE can be defined by pixels or you were able to convert time/date to pixels (I think this can be done in MQL5).
There may be a way around it using a label with a line as the label content - I haven't tried this yet (I don't think labels expand with zoom)
OK, so you want a line draw and set at the same position on screen, use a series of labels with the following character . . .
────────────────────────────────────────────────────────────────────────────
yep have just tried that and it works to a certain extent. I basically have a set of horizontal lines that track moving averages on different timeframes. The 'line' character is placed at the bottom of the label area and not exactly at the same value (price) as the indicators.
This is why I am using a trend line to do this at the moment but the trend line changes size with zoom. I was trying to find your previous thread where you determined the multiplication factor for each zoom level but couldn't find it. Please can you point me in the right direction.
thanks
yep have just tried that and it works to a certain extent. I basically have a set of horizontal lines that track moving averages on different timeframes. The 'line' character is placed at the bottom of the label area and not exactly at the same value (price) as the indicators.
This is why I am using a trend line to do this at the moment but the trend line changes size with zoom. I was trying to find your previous thread where you determined the multiplication factor for each zoom level but couldn't find it. Please can you point me in the right direction.
I wanted to pick up on this thread again as I think there has been a lot of confusion in other threads about lines, objects and zoom. For what I am doing I create a horizontal trend line ahead of price as shown below using this type of code:
ObjectCreate("line",OBJ_TREND,0,Time[0]+Period()*500,price,Time[0]+Period()*1000,price);
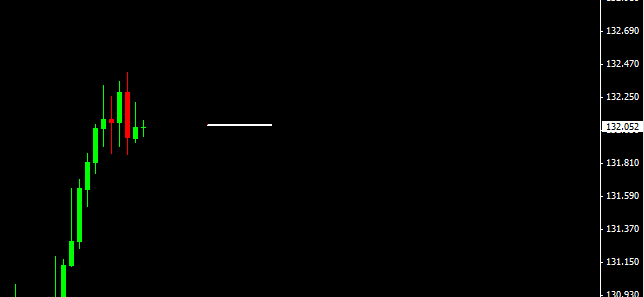
If I zoom this chart the time axis stretches and so does the line. To keep the line the same size when using zoom is a simple solution in theory but I'm struggling with the practice.
If there was a way of determining how many 'time periods' there are between Time[0] and the end of the chart (i.e maximum time value on x-axis) on each time frame then a scaling factor could be used to keep the line the same size across all time frames.
Any ideas on how to achieve this would be greatly appreciated.
thanks
I wanted to pick up on this thread again as I think there has been a lot of confusion in other threads about lines, objects and zoom. For what I am doing I create a horizontal trend line ahead of price as shown below using this type of code:
If I zoom this chart the time axis stretches and so does the line. To keep the line the same size when using zoom is a simple solution in theory but I'm struggling with the practice.
If there was a way of determining how many 'time periods' there are between Time[0] and the end of the chart (i.e maximum time value on x-axis) on each time frame then a scaling factor could be used to keep the line the same size across all time frames.
Any ideas on how to achieve this would be greatly appreciated.
thanks
WindowBarsPerChart() - WindowFirstVisibleBar() ?? write a script to test it . . .
zoom levels . . . https://www.mql5.com/en/forum/141388
- Free trading apps
- Over 8,000 signals for copying
- Economic news for exploring financial markets
You agree to website policy and terms of use
The only way I know to draw a short horizontal line is using the following:
Price1 = Price2 for a horizontal line.
Does anybody have any ideas how to keep the line the same length when using the zoom button?
I am not looking for code just ideas - I have run a blank on this one.
thanks