How to store High-Low values in an Array[] using a "jumping for-loop"?
Thank you for your reply, ubzen.
Thank you for your reply, ubzen.
you making it yourself more difficult then it is needed
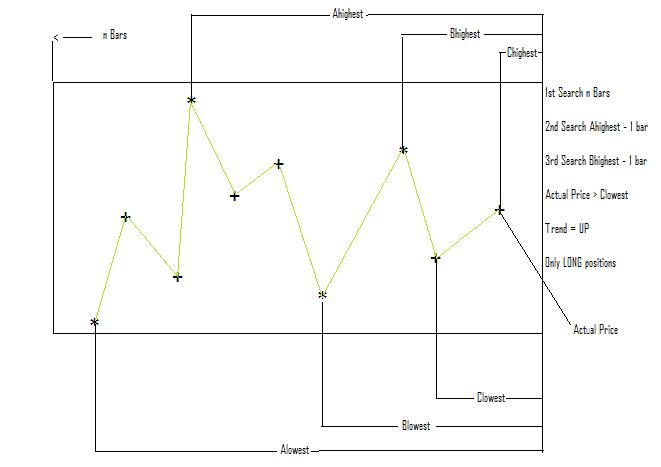
search for highest/lowest n bars and for highest/lowest (n-x) bars
x < n && x>0
Thanks for your reply. deVries.
I'm aiming at the automatic multiple Fibo output as shown in https://www.mql5.com/ru/code/10802 (I saw it after posting my request). You had a look on it as well.
I dont understand you completely.
First search is simple and based on all available chart Bars e.g.
High[iHighest(NULL,0,MODE_HIGH, Bars ,1)]; // Store the HH
Low[iLowest(NULL,0,MODE_LOW, Bars ,1)]; // Store the LL
This will give both max High and max Low values on the chart.
But how to fetch the number of bars in order to define the next search ?
Because the next search has to be based on Minimum(Highest_Bars, Lowest_Bars) - 1 nr. of bars, and so on.
That is a repetitive task that wil/has to stop executing at the actual bar. Your x > 0 I assume.
Could you be more specific? Thanks at forhand.
I don't get you want the highest and lowest of all bars why not choose a long period (24) and longer period (72)
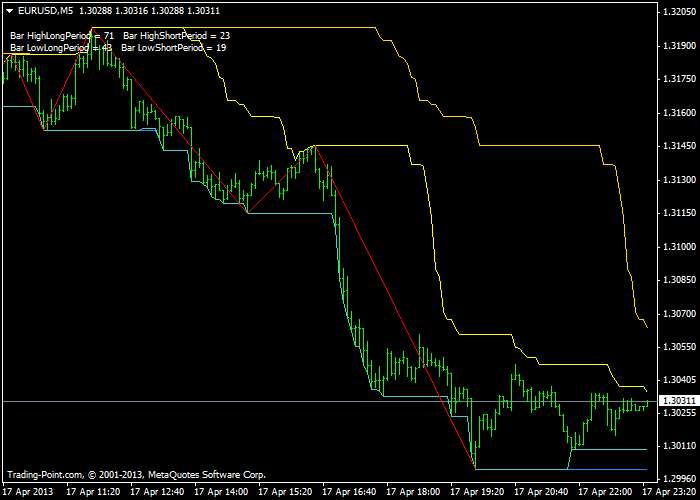
This way you see the highest value of the chosen periods in one time
red line is zigzag period 24
I don't get you want the highest and lowest of all bars why not choose a long period (24) and longer period (72)
This way you see the highest value of the chosen periods in one time
red line is zigzag period 24
Hello Tjipke (ben je ook Nederlander?),
Thank you for your effort!
It is interesting to use ZZ or variants, I experimented as well.
To avoid ZZ repainting (or wait for ZZ plottting) and to have a High-Low search result faster, I came up the idea that is visualized in the drawing.
I used your picture to show what my idea could do:
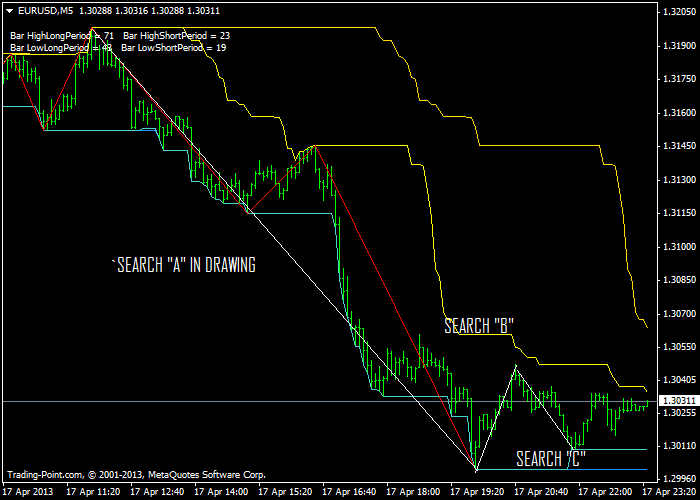
In the "crowded" picture below you see the result of ZZ 24 and ZZ 72 periods along my idea.
Unfortunately, my chart picture does not have the same chart end time, that is why I stopped at SEARCH "C" in the picture above.
In this way, hoping to make it more clear to you.
Support and Resistance become more clear when looking at the three -different colored- Fibo's.
More important, I don't have to wait for e.g. 24 periods ZZ plotting.
I think you will agree, using my idea does give a quicker search result.
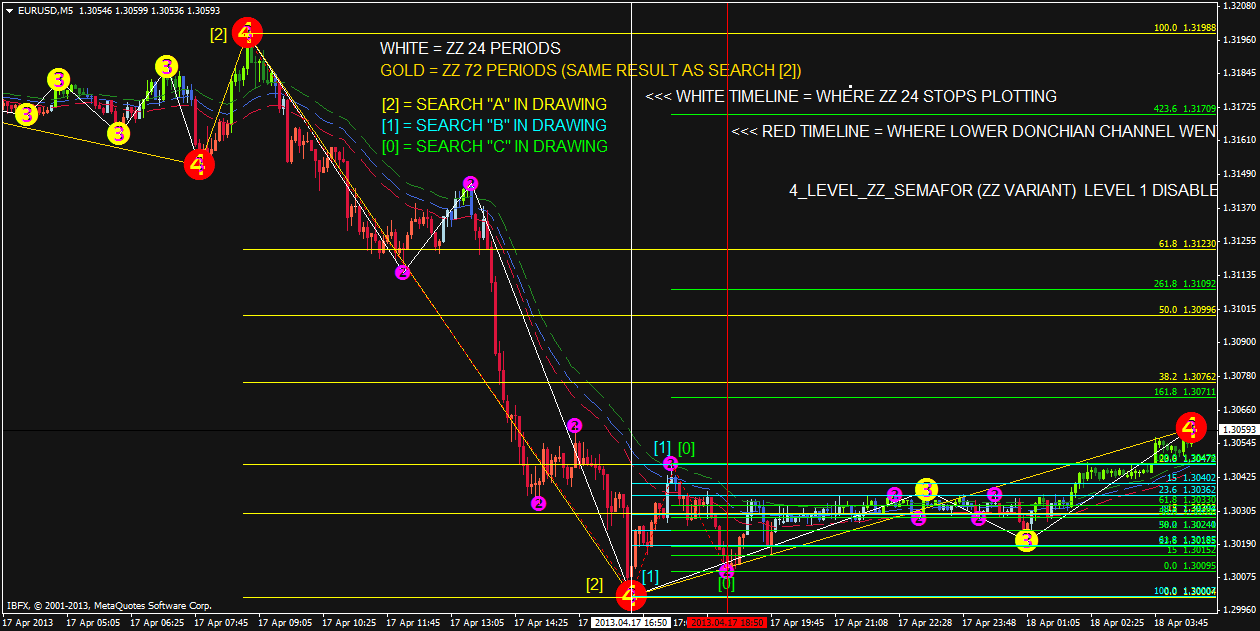
You see that several Fibo levels fall together (yellow and aqua) and (aqua and lime). That is why I like to see multipe Fibo's (and bdeyes as well).
Can you help me with a "jumping for-loop" sample code (see my 2013.04.17 17:52 post above)?
Again, thank you for your help.
EDITED/ADDED:
Notice the last Semafor Level 4 breakout at a later time than the maximum time on your chart.
I tried to plot ZZ 12, 24 and 72 periods. Only two are visually plotted, not three. I think it is a MT4 terminal limitation.
How did you get the Comment with Long and Short term bars? May be three seperate ZZ calls can solve my question.
Hello Tjipke (ben je ook Nederlander?),
Thank you for your effort!
It is interesting to use ZZ or variants, I experimented as well.
To avoid ZZ repainting (or wait for ZZ plottting) and to have a High-Low search result faster, I came up the idea that is visualized in the drawing.
I used your picture to show what my idea could do:
take a look to this How to find the last two ZigZag values?
same way you can find tops bottoms 4_LEVEL_ZZ_SEMA.....
If you want to discuss Trading Strategies you can do it here: Trading systems it is off topic for this Forum.
Hi RaptorUK.
No I don't like to discuss a Trading Strategy, nor violating this forum.
I'm looking/asking for a "jumping for-loop" sample code in order to create multiple Fibo output as shown.
Once I have that, I can test and if succusfull, optionally make it (part-of) a strategy.
I noticed your code snippets all over the place. Are you willing to help me? Thanks at forhand.
take a look to this How to find the last two ZigZag values?
same way you can find tops bottoms 4_LEVEL_ZZ_SEMA.....
Thank you Tjipke. I know to retrieve Semfor signals with iCustom etc..
I will try it with ZigZag 12, 24, 72 but give me a few days, I have to travel abroad.
Bye.
- Free trading apps
- Over 8,000 signals for copying
- Economic news for exploring financial markets
You agree to website policy and terms of use
The High-Low retrieval solution offered by realtrade is powerfull and good (https://www.mql5.com/en/forum/140830).
However, I like to have the smaller "in-between-Highs-Lows" as well.
My goal is to calculate and multiple plot Fibonacci values.
Can someone give me sample code for a special for-loop.
Usually a for-loop in-/decreases by 1 (++ or --). Here I like "to jump".
The retrieved values should ideally be stored in an HiLo_Array[].
Have a look at the picture:
The most recent High-Low has the smallest range (HiLo_Array[0]), HiLo_Array[1] a bigger range, HiLo_Array[2] a more bigger range ... and so on.
Thank you at forhand for your help. Last but not least, credit to realtrade.